

The data show that the choices students make in high school and that paths they take after high school can predictably guide them to specific states of meaningful workforce participation later on.
November 2023
By Kelly Asche, Senior Researcher | Marnie Werner, VP of Research & Operations
For a print version of this report, click here.
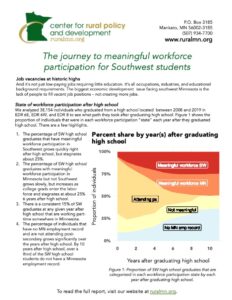
The need for a larger labor force in Southwest Minnesota is at peak heights and employers are looking for strategies that keep local high school and college graduates in the region. Our analysis of 38,154 southwest high school graduates shows that their post-high school paths and plans are related to whether an individual has meaningful workforce participation in Southwest. If their paths and planning for after high school involve programs with regional ties such as attending a college in the region or engaging in career and technical education (CTE) programs, they are significantly more likely to work in the region. However, if their paths and planning take them outside of Southwest, such as attending colleges outside the region, or performing well on ACT and MCA testing, they are significantly more likely to find work outside the region.
We have a narrative that outlines what paths and plans students should make for success after high school, but that narrative is outdated. This old narrative, that young people need to leave rural areas to find better job opportunities, is being replaced by a new narrative that better links the educational plans and paths to local workforce demand. In our analysis, CTE programming indicates that having local ties to the labor force and increasing awareness among our youth of the local opportunities available is a key part of the path and plans that keep them in Southwest.
However, the data also indicates that the old narrative still holds sway: students that plan for and take a path that earns a more “advanced” degree tend to not stay and work in Southwest, despite there being significant demand for their skills locally. These students are pulled to other areas of Minnesota, and in particular, from wherever they graduate college.
Adding to the complexity for southwest Minnesota is the increasing competition of border states. In particular, the state of South Dakota has developed an entire recruitment and marketing campaign targeted at our young people in southern Minnesota. And the data indicates that the region is losing nearly 20% of their own students to other states.
But we also know that students are confronted with many messages, narratives and experiences that shape their perceptions of their local opportunities. Although this analysis paints a story of how to move forward, there are likely many other factors at play that can impact Southwest’s labor force.
Current trends in jobs and the labor force
For decades the economic development narrative about Southwest Minnesota has been, “How do we bring ‘better’ jobs (i.e., better paying jobs requiring higher skilled workers) to the region?” In the last ten years, well before the pandemic, however, that narrative has been turned on its head. Ask anyone in the Southwest Minnesota economy about the job outlook, and you’ll likely get the same answer: “Plentiful.” No matter where you go, you’ll find ads for job openings or, in worst-case scenarios, signs stating that hours of operation or services have been cut due to staffing shortages.
The jobs sitting vacant now are not low-skilled, part-time jobs or summer jobs worked between college semesters. The urgent need today is for workers who can engage in “meaningful workforce participation,” defined here as when an individual is employed for 1,000 or more hours with a single employer over one calendar year. State and local officials looking to make significant investments that impact labor force trends are looking to fill these kinds of jobs.
Today’s staffing shortages originate from a number of key factors:
- A large percentage of workers are retiring and leaving the labor force.
- The pandemic sped up this transition.
- Migration patterns and slowing birth rates in many areas of Minnesota have left fewer people to fill the growing number of job vacancies.
- The continued economic resiliency is making it possible for many businesses to continue expanding, increasing their need for more workers.
- Particular to Southwest Minnesota, attractive education and employment offers and no income taxes across the border in South Dakota.
Figure 1 shows the annual average number of job vacancies in Southwest (chart on the left) and the job vacancy rate (number of vacancies divided by total filled jobs) for each planning region in Minnesota (chart on the right). The job vacancy rate in Southwest Minnesota has been one of the highest in the state since the Great Recession.
Figure 1: Job vacancies across rural Minnesota have increased significantly. Southwest has consistently had one of the highest rates, dating back to 2012. Data: MN DEED – Job Vacancy Survey
A frustrating narrative attached to rural areas is that most of the job opportunities are going to be low paying and require little experience or education. That just isn’t the case. Figure 2 shows that between 2005 and2021, the availability of jobs in the five occupations with the highest median wages has increased between 125% and 800%.
Figure 2: These occupations are the top five highest paid in the Southwest planning region. The number of jobs open in 2021 have more than doubled since 2005. Data: MN DEED, Job vacancy Survey
Essentially, the Southwest region has high demand for workforce in every occupation, industry, and educational background. The purpose of highlighting this fact is that the results below will show a consistent theme: Southwest high school students are more likely to stay or be in the region with meaningful workforce participation if they have a “less robust” educational background—a background that may not qualify them for the jobs that pay the most. Although there are many factors that go into a local student’s perception of local opportunities, there does seem to be a lack of “pull factors” and engagement with these students to increase their awareness of local opportunities for people with more advanced degrees. This will be discussed more in a later section.
The five “states” of workforce participation after high school
In Southwest Minnesota, a way economic developers would like to combat the workforce shortage is to increase the percentage of the region’s high school graduates who end up in “meaningful” workforce participation in the region after high school years. We defined “meaningful” workforce participation as working 1,000+ hours with a single employer in a calendar year. While other levels of workforce participation, such as part-time and/or having multiple employers, are also important pieces of the region’s labor force puzzle, steady, consistent employment is the primary concern right now among workforce development organizations and employers.
The primary goal of this research, therefore, was to follow a large cohort of Southwest Minnesota high school students to study their educational and working paths from high school graduation to ten years afterward, and in particular, to understand how many ended up in or did not end up in meaningful workforce participation within Southwest Minnesota by Year 10. By identifying the paths students take during high school and the plans they make that led to them to their eventual work situation, we can try to understand what it is about these factors that seem to push and pull individuals toward and away from meaningful workforce participation in the Southwest region.
To do this, we identified the employment “state” individuals were in each year after high school graduation. We also explored the educational paths taken by Southwest students after graduating high school and things they did as part of plans to achieve their post-high school objectives—for example taking the ACT. After cleaning the data, our dataset included 38,154 individuals who had:
- graduated from a high school,
- their high school was located in Economic Development Regions 6W, 6E, or 8, which comprise parts of the Southwest[1] and Central planning regions (Figure 3), and
- they graduated between the years 2008 and 2019.[2]
Figure 3: The cohort used were all from the very Southwest corner of the state.
While analyzing the data, we found people moved fairly reliably through at least one and up to five categories or “states” of workforce participation after graduating from high school:
- Meaningful workforce participation, Southwest: The individual worked 1,000+ hours for a single employer in Southwest Minnesota over the calendar year.
- Meaningful workforce participation, Minnesota: The individual worked 1,000+ hours for a single employer located in Minnesota, but not in Southwest, over the calendar year.
- Attending post-secondary schooling (PS): The individual is attending post-secondary school that year anywhere.
- Not meaningful: The individual is working anywhere in Minnesota but does not meet the “meaningful employment” criteria and is not attending post-secondary school.
- No MN employment record: This one can mean either the individual is working but not in Minnesota or the person is in Minnesota but not working, and in either case is not attending post-secondary. There is simply no record of their employment in the state that year.
These are not completely “clean” categories. For example, someone could be attending post-secondary, but also have a part-time or full-time job on the side. Yet this individual would be categorized as “attending post-secondary.”[3]
Figure 4 shows the percentage of individuals in each employment state each year after high school graduation. It reveals some important trends:
- The percentage of individuals engaged in meaningful workforce participation in Southwest grows quickly, from 12% of the cohort in Year 1 (the first year after high school graduation) to 23% by Year 5. However, growth stalls out after that.
- The percentage of individuals who have meaningful workforce participation in Minnesota but not Southwest grows slowly at first but balloons by Year 5, which coincides with the decrease in the percentage of individuals attending post-secondary, suggesting that students are graduating from college and entering the workforce elsewhere in Minnesota.
- The percentage of individuals without meaningful workforce participation remains consistent from Year 1 to Year 11. These are not necessarily the same people from one year to the next, but the group’s share of the total, about 15%, stays remarkably steady.
- The percentage of individuals who do not have a Minnesota employment record and are not attending a post-secondary school grows steadily after high school graduation. By Year 11, 36% of individuals do not have a Minnesota employment record and are not attending a post-secondary school. So, they are either in Minnesota but not working or are working somewhere outside the state.
Figure 4: The percentage of individuals making up each “employment state” shows consistent trends years after graduating high school. Data: MN Statewide Longitudinal Education Data System
Figure 5 provides another way to look at the percentages in Figure 4 (not including “attending post-secondary”). The charts clearly show the quick growth and plateau in the share of individuals with meaningful workforce participation in Southwest, the slow growth of the percentage of individuals with meaningful workforce participation in Minnesota but not Southwest, the unchanging 15% of individuals who are working but not at the “meaningful workforce participation” threshold, and the large percentage of individuals with no Minnesota employment record.
Figure 5: Data – MN Office of Higher Education | MN Department of Employment and Economic Development
The following discussion of the results focuses on three of these four workforce participation states: meaningful workforce participation in Southwest, meaningful workforce participation in Minnesota but not Southwest, and those with no Minnesota employment record. The annual percentage of individuals that did not have meaningful workforce participation was consistently around 15% and few significant relationships were identified.
Results: Paths and planning
What the data is showing us, especially in Figure 4, is the migration patterns/tendencies of students from Southwest Minnesota after they graduate from high school. The data then help us understand what paths those students took after graduating high school and what plans they made during high school that eventually led to those outcomes.
Our analysis of these paths and plans of students included lots of variables (for the full list, see Appendix A). One way to think about this is to view it as a process: students are making plans during high school for life after they graduate, and then they take the pathway after graduating high school, and then throughout their time they end up in different workforce participation states.

And although there is a lot of nuance in the actual results, the following discussion are the variables that rose to the top as being the most important. The list below provides the variables that were identified as being the most consistently important factors in which workforce participation state a student ended up in after high school.
We will start by exploring the paths taken after high school and their relation to the workforce participation states an individual ends up in after high school. We will then shift gears and look at how the plans during high school are related to not only which workforce participation state students end up in, but also which path they choose after graduating high school.
Paths after high school
Takeaway 1: Staying local is important to Southwest labor force needs
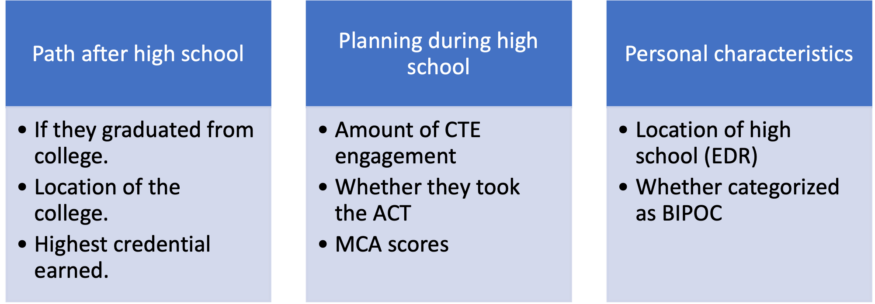
The data were fairly clear: students who ended up in particular employment states tended to follow particular paths and plans during high school. In our analysis, we identified three strong factors that correlated with an individual’s workforce participation state after high school:
- Location of the college from which they graduated.
- Highest credential or degree earned.
- Type of college from which they graduated.
Figure 6 summarizes the post-secondary paths that were significantly more likely to lead to the workforce participation state. For example, 39% of the individuals that earned an associate degree or lesser credential had meaningful workforce participation in Southwest five years after graduating high school. This percentage was significantly higher than if a student earned a bachelor’s degree or higher, or those that did not graduate college.
Figure 6: Post-high school paths that led Southwest students to their eventual category of workforce participation. At Year 5 post high school, the paths students followed are quite consistent.
For example (see Figure 4), students who were in meaningful workforce participation in Southwest Minnesota five years after graduating high school tended to have graduated from a college in Southwest, and/or graduated from a two-year college located anywhere, and/or with a credential or associate degree earned anywhere (Figure 5). Those with meaningful workforce participation elsewhere in Minnesota were more likely to have graduated from a four-year college somewhere in the state with a bachelor’s degree or higher. Those with no Minnesota employment record (implying they were either not working or were working somewhere outside the state) either did not attend college or they graduated from an out-of-state college.
Figure 7: Significantly higher percentages of individuals in meaningful workforce participation in Southwest Minnesota five years after graduating high school had graduated from a two-year college, from a college in the Southwest region, and/or earned an associate degree or another type of credential. Data: MN Statewide Longitudinal Education Data System
Takeaway 2: After high school paths: Not enough students attending local colleges
The data also show that although a significant percentage of the students with meaningful workforce participation in Southwest Minnesota followed this college/degree pattern, the actual number of students who did is still very low. Figure 8 shows the percentage of Southwest high school graduates that follow each type of after high school path, with each path highlighted by each type of workforce participation state it benefits the most. The paths highlighted in red are the paths that benefit Southwest labor force needs the most. Unfortunately, a significantly large number of Southwest high school graduates are following post-high school paths that lead to meaningful workforce participation outside of Southwest. Only 12% of Southwest high school graduates finished college in Southwest, 24% earned an associate degree or a similar type of credential, and only 19% graduated from a two-year college. These percentages are all significantly lower than the other post-high school paths, including those who followed the no-college path.
Figure 8: Although higher percentages of SW high school graduates that finish college in Southwest earn an associate degree or lesser credential, or graduate from a two-year college have meaningful workforce participation in Southwest (highlighted in red), these categories, unfortunately, have the lowest numbers.
Planning during high school
Besides the paths students took after high school graduation, our data analysis also identified which types of curricula and programming students took during high school as part of a plan helped lead them to their eventual workforce participation outcomes. The results showed that not only did planning influence the path after high school, but it also appeared to increase or decrease the likelihood of specific employment states years after high school.
The analysis identified a specific set of variables, or choices students made, as having an impact years after graduating high school:
- Number of CTE courses taken
- CTE achievement level
- Taking the ACT
- MCA scores
Just like the college paths students took after high school, the choices students made during high school concerning their courses appeared to influence their outcome, too.
Takeaway 3: increasing the likelihood for meaningful workforce participation in Southwest with Career and Technical Education and local career awareness
Coursework taken during high school, specifically career and technical education courses (CTE), appeared to be a definite factor in whether a student had meaningful workforce participation in the Southwest region after high school. And CTE is a decent proxy for overall programming that increases awareness of local and regional career opportunities due to how CTE is developed. These programs are defined as a “sequence of courses that integrates core academic knowledge with technical and occupational knowledge and skills to provide students a pathway to postsecondary education and careers”.[4] And one of the core tenants of CTE programming development is it’s partnership with local employers and communities and identifying careers and jobs that are in-demand and highly skilled. And it’s important to note how much CTE programming has changed since the days of it being “shop” class and how many of these programs are for high skilled careers[5].
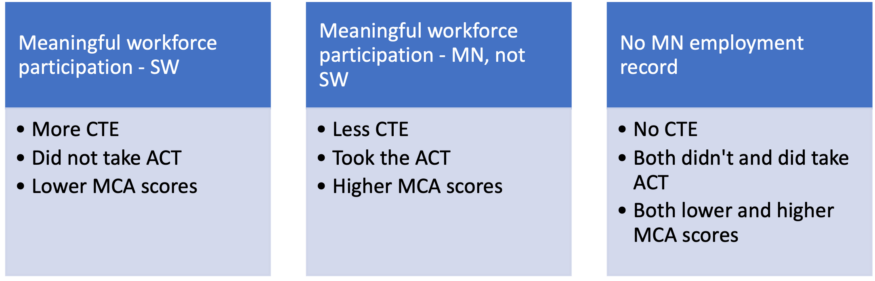
Figure 9 shows that individuals with meaningful workforce participation in Southwest took significantly more CTE courses than individuals in the other workforce participation states.
Figure 9: The number of total CTE courses taken is higher for individuals with meaningful workforce participation in Southwest. Data: MN Statewide Longitudinal Education Data System
If you are unfamiliar with a boxplot, the boxes provide the 1st quartile (bottom of the box), median (black line in middle of box), mean (green dot), and third quartile (top of the box). Table 1 shows that the highest values for each of these metrics is in the meaningful workforce participation in Southwest state.
Table 1: These are the first and third quartile values as well as the mean and median number of CTE courses taken for each workforce participation state. Data: MN Statewide Longitudinal Education Data System
This message also holds when breaking down CTE engagement by their achievement level (completer/concentrator vs participant vs no CTE experience[6]). Figure 10 shows that significantly higher percentages of individuals with at least some CTE experience have meaningful workforce participation in Southwest years after graduating high school.
Figure 10: Significantly higher percentages of individuals that either are CTE concentrators/completers or take at least one CTE course have meaningful workforce participation in Southwest MN one, five, and ten years after graduating high school, compared to the group that has no CTE experience. Data: MN State Longitudinal Education Data System
The results also showed that not only does this form of planning during high school impact which workforce participation state an individual ends up in, it also impacts the path taken after high school. Since we already know that higher proportions of individuals that graduate from a Southwest college, graduate from a 2-year college located anywhere, and/or earn an associate degree have meaningful workforce participation in Southwest. Analysis also shows higher engagement in CTE during high school leads to higher proportions that follow these paths after high school (Figure 11).
Figure 11: Not only does participation in CTE increase the likelihood that an individual will follow a post-high school path that benefits the region’s labor force numbers, it also decreases the likelihood that individuals will follow the paths that don’t benefit the region’s numbers. Data – MN Statewide Longitudinal Education Data System
In addition, more engagement with CTE decreases the likeliness that an individual will follow paths after high school that don’t benefit the Southwest labor force numbers. Figure 12 shows that higher percentages of individuals with no CTE programming don’t go to college, or they attend college out of the state, earn a bachelor’s degree or higher, and/or graduate from a 4-year college. All of these paths after high school have lower proportions of individuals with meaningful workforce participation in Southwest.
Figure 12: CTE engagement decreases the likelihood that an individual will follow a post-high school path that isn’t beneficial to the region’s labor force numbers such as not attending college or finishing at a college outside of Minnesota. Data: MN Statewide Longitudinal Education Data System
It’s important to understand that no one is arguing that there should be less students following these paths after high school. However, it does raise an interesting question. If there is such a demand for a diversely educated labor force, why is there such a drastic difference in the proportion of individuals that have meaningful workforce participation in Southwest across educational backgrounds (college location, type, credential)?
As we will discuss further into this report, there are a lot of factors that play a role in a student’s perceptions of local opportunities. But a big part is likely due to how much they are being engaged and being made aware of the local opportunities. Career and technical education is rooted in the local workforce needs – they aren’t going to provide a CTE program if the particular subject matter isn’t related to an occupation or industry considered “in-demand and highly skilled” in the local economy. It is also rooted in what community and technical colleges can provide in programming. What this analysis indicates is the need to expand programming that draws awareness to local opportunities that require more advanced credentials.
Takeaway 4: planning for earning an advanced degree increases the likelihood for meaningful workforce participation outside of Southwest.
These figures highlight the fact that students who take the ACT and perform well on MCA tests and subsequently perform better in traditional academics are choosing paths after high school that are more likely to take them out of the region’s labor force for at least 10 years.
In the previous Figure 9, it showed that the group of students at five years after college with meaningful workforce participation outside of Southwest but still in Minnesota had taken fewer CTE courses to the group with meaningful workforce participation in Southwest.
Our analysis identified two other factors—taking the ACT and high MCA scores—that had an impact on an individual’s future meaningful workforce participation for years after high school. Figure 13 shows that 29% of individuals who took the ACT had meaningful workforce participation in Minnesota but outside Southwest, significantly higher than the 15% that didn’t take the ACT. The same can said for higher MCA scores – ~25% of individuals who scored a “3” or “4” on their MCA tests had meaningful workforce participation in Minnesota but not Southwest which is significantly higher than the percentages of individuals who scored a “1” or “2”.
Figure 13: Higher percentages of individuals that take the ACT and have higher MCA scores have meaningful workforce participation outside of Southwest but in Minnesota. Data: MN Statewide Longitudinal Education Data System
And just like how taking more CTE courses was related to the path individuals took after high school, the same can be said about taking the ACT and performing well on the MCA tests.
Figure 14 shows that a significantly higher percentage of ACT takers attend and finish at colleges located outside of Southwest, at four-year colleges, and/or earn bachelor’s degrees, which makes sense since students who are planning on being “college bound” are more likely to take the ACT. Essentially, following these plans during high school lead to a higher proportion of individuals to follow paths after high school with higher proportions of individuals that have meaningful workforce participation OUTSIDE of southwest.
Figure 14: A significantly higher percentage of individuals that took the ACT follow post-high school paths that have higher percentages with meaningful workforce participation in MN, but not SW. Data: MN Statewide Longitudinal Education Data System
These trends are also highlighted in MCA scores. Figure 15 highlights a higher percentage of individuals that score an MCA math score of 3 or 4 follow post-high school paths that lead to higher percentages of individuals with meaningful workforce participation outside of Southwest. And even though these figures use MCA math scores, analysis shows that these same trends apply to MCA reading and MCA science scores as well.
Figure 15: Significantly higher percentages of individuals with MCA scores of 3 or 4 follow post-high school paths that don’t benefit Southwest labor numbers as much as other paths.. Data: MN Statewide Longitudinal Education Data System
Again, someone could argue that this is an indicator of “brain drain” – essentially the lower proportion of individuals that perform well on high school tests are leaving because there are not local opportunities available to them. However, this isn’t the case in today’s labor force market. Rather, this is another sign of a disconnect in how students are being informed about opportunities available to them locally. There is no need to leave if your primary concern is having career opportunities that match your skillset.
Takeaway 5: No Minnesota employment record: border state competition taking non-college grads and college grads.
The “no Minnesota employment record” is a bit complicated since it comprises groups of people that our meaningful workforce participation states can’t categorize. To be in this category of “having no Minnesota employment record” there are likely a number of reasons, but we for sure know the following about this group;
- They are not attending post-secondary anywhere.
- They are not employed with an organization that DEED tracks with their employment records – Minnesota employers.
With this said, there are a few scenarios in which the individuals could be in;
- An individual is working outside of Minnesota, this includes anyone that’s living in Minnesota but employed federally. Our records do not track these individuals.
- They are in the military.
- The individual is self-employed.
- The individual is not participating in the labor force.
- Passed away.
Despite this vagueness, the data can still show us characteristics of this group. First, we know they participated less in CTE programming compared to the other two groups: 36% of the individuals who had zero CTE experience had no Minnesota employment record (Figure 16).
Figure 16: The chart on the left shows that group of individuals that have no Minnesota employment record took significantly less CTE courses. The chart on the right shows that a significantly higher proportion of individuals with no CTE experience had no Minnesota employment record. Data: MN Statewide Longitudinal Education Data System
These results make sense: someone involved in CTE during high school is more likely to be introduced to opportunities available in the region and will likely develop stronger ties to the region. Why does this matter? Because when it comes to retaining workforce in Greater Minnesota, rural areas have a lot of out-of-state competition.
And these local ties seem to impact an individual’s path after high school. Figure 17 shows that a significantly higher percentage of that either never attended college (37%), graduated from a college located in North Dakota, South Dakota, or Iowa (45%) or from another state (45%) did not have a Minnesota employment record five years after graduating high school. And these paths also lead to a significantly lower proportion of individuals with meaningful workforce participation in Southwest.
Figure 17: By five years after graduating high school, a significantly higher percentage of individuals that never attended college, or graduated from a college located out of Minnesota do not have a Minnesota employment record. Data: MN Statewide Longitudinal Education Data System
What this tells us, and what the academic literature tells us, is that there are of course many factors that go into where a student decides to go to college—or whether to go to college—including the perceptions they have of places they want to live and work and their own self-efficacy. However, this data also supports the well-known observation that people tend to stay and start a career near where they went to college.
What’s on many minds in Southwest Minnesota is the loss in the labor force from their students leaving the state. Although we can’t get exact numbers, we can do some “back-of-the-envelope” estimates.
First we need to figure out how many of these individuals that don’t have a Minnesota employment record are not participating in the labor force. To do this we will calculate the average labor force participation rate of ages 18 to 29, for each year (2008 – 2019) in the counties within our research region. We will than subtract that rate from 100% which will give us the average percentage of individuals that do not participate in the labor force. When we apply this to the individuals that don’t have a Minnesota employment record 5 years after graduating high school (5,067 individuals) we get 659 individuals that are not participating in the labor force. This leaves us with a rough approximation of 4,408 individuals. If we subtract individuals that have federal employment, or are self-employed, and/or are serving in the military, we can conservatively estimate that there are roughly 4,000 SW high school graduates that are participating in the labor force in another state. This is roughly 22% of all the individuals five years after high school.
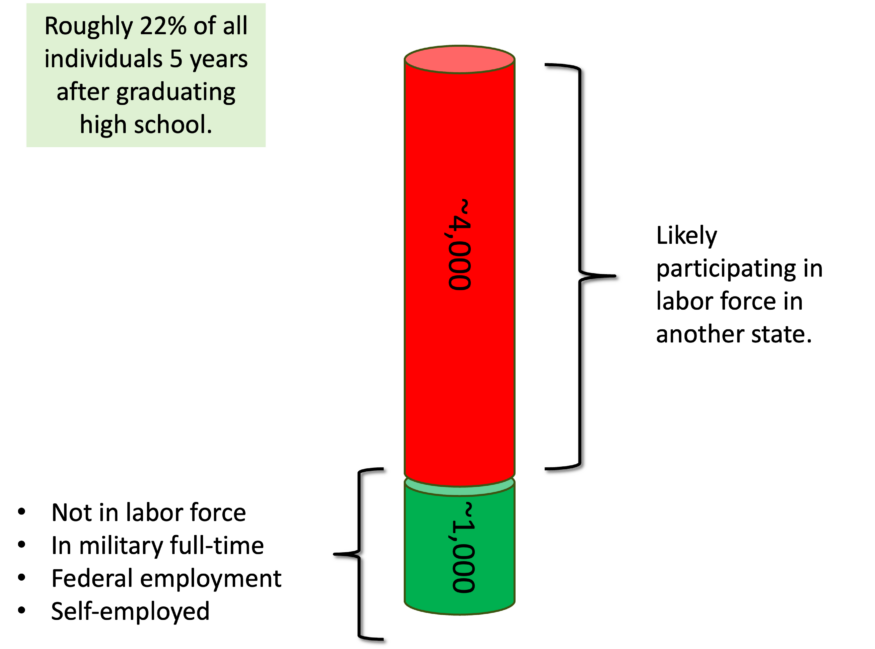
Although we aren’t able to figure out if these individuals have meaningful workforce participation in another state or if they are part-time, but it does raise awareness of how significant this trend is – Southwest is literally losing thousands of students to bordering states. And the competition is only going to increase as these states continue to invest in recruitment and marketing campaigns touting their opportunities and programs to students in Southwest Minnesota.
Individual characteristics impacting post-high school paths
So far, we have explored variables that are “choices”: an individual can choose to take the ACT or attend a college in the region. A number of these variables came up, however, that weren’t choices but rather inherent to the individual. Two of them, where the student lived and race or ethnicity, were particularly significant.
Takeaway 6: EDRs leading to different post-high school paths
If we take the students with meaningful workforce participation in the Southwest region and break them out by EDR, we won’t see a huge difference. Figure 18 shows that between 25% and 30% of the students from each EDR had meaningful workforce participation in the Southwest region after high school one, five and ten years after high school graduation.
Figure 18: A relatively equal percentage of individuals from high school EDRs have meaningful workforce participation in Southwest. Data: MN Statewide Longitudinal Education Data System
However, it’s the other workforce participation states (meaningful workforce participation outside of Southwest) that differ noticeably. Figure 19 shows that a significantly larger percentage of individuals from EDR 6E have meaningful workforce participation in Minnesota but outside of Southwest: 31% compared to 19% in EDR 6W and EDR 8. It also shows that a significantly higher percentage of individuals from EDR 6W and 8 don’t have a Minnesota employment record five years after graduating high school: 28% and 32% respectively compared to 21% of EDR 6E graduates. This likely points to those regions losing more high school graduates to neighboring states.
Figure 19: There are significant differences in the percentage of individuals that had meaningful workforce participation in MN vs. having no Minnesota employment record depending on the EDR from which an individual graduated. This is at five years after graduating high school but the trends follow in all years. Data: MN Statewide Longitudinal Education Data System
And these proportions make sense when you look at the proportions of individuals who follow specific paths after high school. Figure 20 shows that a significantly higher percentage of individuals from EDR 8 and 6W finished college in a border state, which also had higher proportions of individuals with no MN employment record. On the other hand, EDR 6E had a significantly larger proportion of individuals graduate from a college outside of southwest, but still in Minnesota. This path had a higher proportion of individuals with meaningful workforce participation in Minnesota, but outside Southwest.
Figure 20: EDR 6E had a significantly higher percentage of individuals that finished college in Minnesota, but outside the region. EDR 8 had a significantly higher percentage that finished college in the region, but also, along with 6W had a significantly higher percentages that finished college in. a border state. Data: MN Statewide Longitudinal Education Data System
Takeaway 7: BIPOC populations have high percentages with no MN employment record.
Analysis showed significant differences in the proportion of individuals with no Minnesota employment record by white compared to BIPOC populations. Figure 21 shows that higher percentages of BIPOC populations don’t have a Minnesota employment record. The gap between white and BIPOC populations was smaller by ten years after high school, likely because of the very different post-high school paths taken by white and BIPOC populations.
Figure 21: A significantly higher percentage of BIPOC individuals did not have a Minnesota employment record. Data: MN Statewide Longitudinal Education Data System
Figure 22 shows that nearly 40% of BIPOC populations did not graduate from a post-secondary institution by five years after high school compared to 21% of white individuals. This particular post-high school path appeared to result in a higher percentage of individuals with no Minnesota employment record.
Figure 22: Nearly 40% of BIPOC populations did not graduate from college compared to 21% of white individuals. Having no credential also typically resulted in lower percentages with meaningful workforce participation in Southwest. Data: MN Statewide Longitudinal Education Data System
There are likely a lot of characteristics that factor into these trends concerning race that aren’t captured in the data we have available, but it’s important for educators who have a diverse student body to be aware that these differences exist and to understand what might be some of the barriers and/or differences that lead to different employment outcomes. For example, a variable that analyzed the relationship between whether a student was categorized as having limited English proficiency followed these same trends. Thus, English proficiency might be a factor in why employment states and post-high school paths are so different.
Why leave if opportunities exist locally?
For decades, rural areas have experienced out-migration due to the allure of higher paying jobs that usually required a robust educational background, and were typically located outside of the region – this is typically referred to as the “brain drain”, a very misleading and offensive term that describes how the “most educated” leave rural areas. But times have changed. Job openings for all occupations, industries, qualifications, and skill sets are at historic highs.
As our results will show, Southwest is still battling this trend of their young people preparing themselves in high school to leave the region (i.e. higher ACT and MCA scores). Yet, the shift in the job market brings to question why our rural areas continue to experience out-migration of young people if there isn’t necessarily more opportunity outside of their region, comparatively. The following results indicate that a student’s knowledge and connection to the local opportunities play a role (i.e. CTE engagement).
Much of our education system is built on a historic framework that prepared the “brightest” for a future that provided higher paying opportunities outside of their rural area. And even though the job market has shifted, these educational frameworks have not fully adjusted, nor has the narrative surrounding local opportunities.
To change a student’s perception of their local opportunities, it takes a full-press effort from the region. There are just so many factors that shape a student’s beliefs about the opportunities available to them, their preferences in a place to live and work, and their own self-belief in their own skills.
Academic research has categorized, measured and explained a number of factors that seem to play a role in the post-high school path that a student chooses. Here’s a list of categories that outline SOME of the factors that have been identified in academic research;
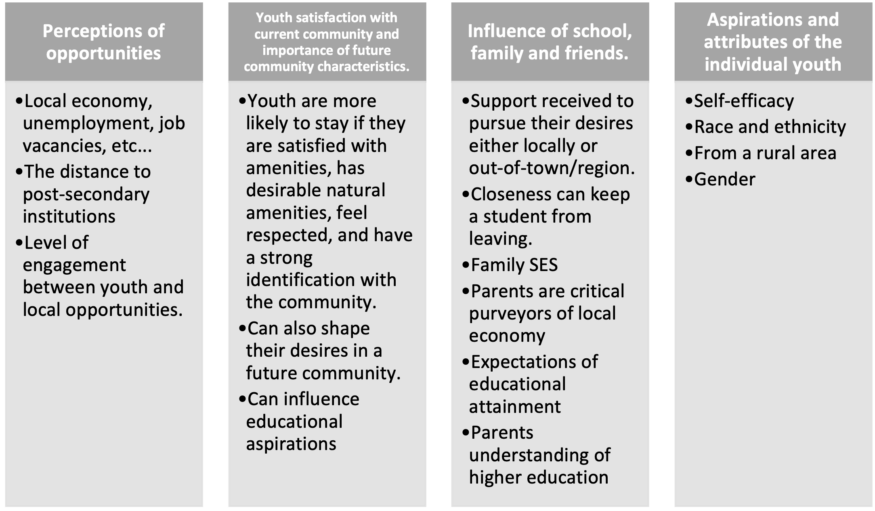
Just this limited list shows the breadth and depth of factors that economic developers are working with and against. Just having a “regional job fair” will likely not be enough to influence or change a student’s perception of the region long-term because there are so many other relationships and actors that might be providing a different narrative – a narrative based on 1970s experiences and beliefs[7]. This is why it’s important to understand what paths and plans a student is engaging in and to constantly make them aware of the local opportunities. It’s not about changing all their minds, but there is definitely room to increase the number of young people that stay locally for their education and career.
Recommendations
Keep an eye on where students are coming from and also where they’re going
One thing that became evident in this analysis is that by Year 5, a percentage of people from all five post-secondary education groups were in the Southwest workforce (Figure 23), with those who went to college in Southwest Minnesota being the largest contributor. But it’s also apparent that an even larger percentage of people went someplace else. While 43% or 960 of the people who attended a college in Southwest Minnesota went on to meaningful workforce participation in the Southwest region, 57% went someplace else. And while the group of students who finished college in Minnesota but outside the Southwest region contributed even more people to the Southwest workforce (1,144), that is still only 27% of that group—73% went someplace else after college.
And yet, almost half of the people to finished college in Southwest Minnesota were working in Southwest Minnesota at Year 5, a larger percentage than any of the other groups. What seems to make this work? Understanding the flow of people and the factors behind it should help workforce professionals and policy makers in their decisions on where to invest resources.
Figure 23: Even though a higher percentage of students who graduate from a college in Southwest have meaningful workforce participation in Southwest, there is so few that go to these colleges that it doesn’t contribute as much to the region’s labor force compared to other post-high school paths. Data: MN Statewide Longitudinal Education Data System
Invest in programs that increase awareness of local opportunities
It was apparent in the analysis that programs like CTE, which is rooted in developing a local labor force that meets the needs of local employers, have an impact on the trajectory of a student’s path after high school. After decades of disinvestment, CTE has received an injection of support, resources, and encouragement over the last five years. These efforts should continue and be bolstered into the future.
In addition, academic literature is also clear that factors playing a role in a student’s perceptions of local opportunities are broad and far-reaching. Changing a student’s perceptions is going to take more than a regional job fair or increasing CTE programming, which is why it will take a broad spectrum of initiatives—opportunities like internships, apprenticeships, and more—to overcome old narratives, stereotypes, and beliefs about what opportunities exist locally. And everyone will need to be involved—from teachers and college recruiters to parents. The entire education system needs to play a role in shaping the region’s labor force.
Tweak existing programs to compete with Build Dakota
Develop meaningful competition with Build Dakota
You will get dirty looks from people in southern Minnesota if you bring up the Build Dakota program, an initiative that provides tuition and books for any student that graduates from a two-year college and works in South Dakota in an occupation considered “in-demand” for three years. But while Build Dakota may seem like another obstacle in the ongoing battle for workers, the program could be looked on as a model for a similar program here in Minnesota, where we already have an impressive infrastructure of higher education institutions and K-12 schools. We also already enjoy a high rate of cooperation between businesses and workforce development programs, and we have many philanthropic organizations with a history of investing funds in promising long-term projects. Is Minnesota ready for a similar model?
Minnesota took a step in the right direction with North Star Promise, a program that provides “a pathway to free tuition and fees for eligible Minnesota residents at any of the 26 state colleges and seven state universities of Minnesota State.” It’s another pull factor for students to stay in Southwest instead of going to a border state for college. Keeping students in Minnesota post-secondary programs is important because typically, without incentives, individuals stay and start their careers in the region where they graduated college, something that was clear in the analysis: where a Southwest student goes to college strongly influences whether that individual stays and becomes a member of the workforce.
Figure 24 shows that that nearly 27% of Southwest high schoolers who graduated from college did so from a campus located in their region, but that means 73% of those students finished college outside the region. In fact, South Dakota was the largest draw, at 19%, larger than any individual region in Minnesota.
Figure 24: The largest percentage of Southwest college graduates do so from campuses located across central Minnesota, the twin cities, and South Dakota. Data: MN Statewide Longitudinal Education Data System
This shows that the North Star Promise can be a key tool in decreasing the percentage of students in Southwest Minnesota that finish colleges in other states. There are many people excited about this possibility.
However, there are a couple of key differences, that should be considered in future changes to North Star Promise.
North Star Promise could be a key tool in drawing Southwest Minnesota students away from South Dakota and other states. Many people are excited about this possibility. However, there are a few key things about Build Dakota that make it a greater challenge.
Build Dakota allows businesses and non-profit organizations to “sponsor” students and help pay for their tuition and books.
Not only does this public-private partnership increase the sustainability of the program, making it not completely reliant on state funding, it also creates local ties between high school graduates and career opportunities in their regions, an important factor in building up a local labor force with a region’s own students.
A student doesn’t have to be from South Dakota to participate in Build Dakota.
One of the powerful strategies of Build Dakota is that it doesn’t care if you’re from South Dakota. They have recognized that the Midwest states are all competing for each other’s ultimate resource: people. By providing scholarships to students in Nebraska, Minnesota, North Dakota, and Iowa, they are attempting to not only keep more of their “own,” but to also build up their labor force with people from other states.
It has an employment requirement.
The Build Dakota program requires a three-year commitment after graduation to working in South Dakota in a field categorized as “in-demand.” Probably one of the biggest issues regarding the North Star Promise program is that there is no requirement built in that the students receiving the scholarship will then give back to the state by being a part of its labor force for a specific number of years. No work requirement makes it possible for students go to college in Minnesota at the state’s expense, then jump over to South Dakota or North Dakota or anyplace else to work.
Invest in programs that continue to make rural areas attractive places to live and work
A major factor that plays a role in whether someone makes a career in a region is whether they want to live there, but deciding where to live is about more than work and careers. Never in modern history has labor held so much leverage, and their ability to pick and choose the job and community they want to live in has never been stronger. Southwest is competing against South Dakota, North Dakota, Iowa, and every other rural region in Minnesota for its own people, but places like South Dakota have upped the stakes.
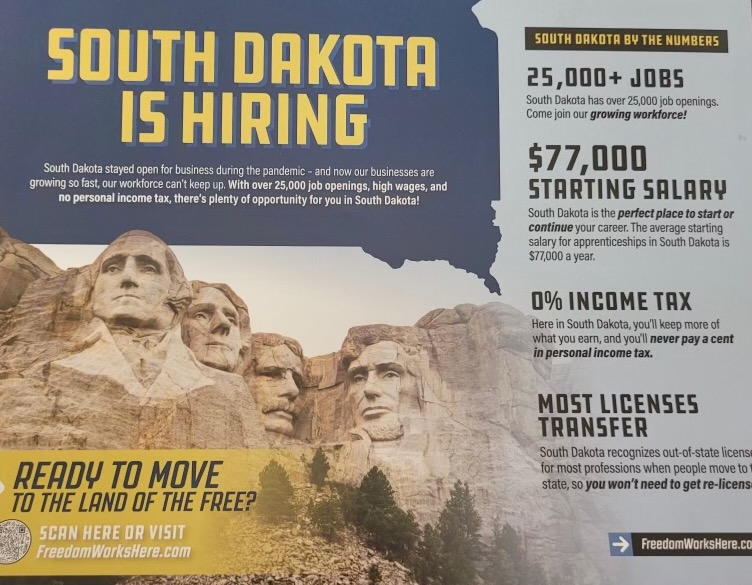
Figure 25: Recruitment postcards were sent to individuals in southern Minnesota from the state of South Dakota.
To retain young people, programs will need to be develop that promote the region as a great place to live and work and continue to invest in amenities that retain our young people. You can read our report on these types of initiatives here[8].
A thank you
A lot of individuals went into this project and we want to thank them for taking their valuable time to provide advice, guidance and assistance.
- Meredith Fergus, Director of Research – MN Office of Higher Education
- Nora Morris, SLEDS Director – MN Office of Higher Education
- Luke Greiner, Labor Analysis – MN Department of Employment and Economic Development
- Eric Schwankl, Education Consultant, Southwest West Central Service Cooperative
- Neil Linscheid, Educator – U of MN Extension | Center for Community Vitality
- Engin Sungur – Professor, Statistics – U of MN Morris
Methodology
Our research was focused on exploring the paths taken by Southwest high schoolers after they graduate and to identify which factors increase the likelihood of someone having meaningful workforce participation in the Southwest region in the years following graduation. The individuals in our dataset have:
- graduated from a high school (status end 8 or 9),
- between the years 2008 and 2019, and
- their high school was located in EDR 6W, EDR 6E, and EDR 8.
After applying these criteria, the number of individuals in the dataset was 38,154 individuals.
For these individuals we joined their educational and employment records with the intent to identify factors that lead to various employment states of the individuals. These records were provided from the Minnesota Statewide Longitudinal Education Data System (SLEDS).
With these records we were able to gain access to various variables about the individuals including certain demographics, high school experiences, post-secondary experiences (if any), and employment of the individual starting with their Sophomore high school year to eleven years after graduating high school (up to 2019).
Our first step was to categorize each individual into an “employment state” (defined in more detail later) for each year after they graduated high school. We used the following process to categorize individuals into each employment state;
- Check to see if they were attending college, and if they were they were categorized as “attending ps”.
- If not attending college, we checked to see if they had a Minnesota employment record.
- If they had a Minnesota employment record we determined if they had “meaningful workforce participation” (defined later) and where their employment was located.
- If they were not attending college and they did not have a Minnesota employment record, then they were categorized as having “no MN employment record”. This means they had no post-secondary record in the United States that year and no Minnesota employment record.
To determine which high school and post-high school experiences may be playing a larger role in an individual’s employment state after high school, we utilized a couple of different methods to filter out variables that were either redundant or don’t seem as important. The figure below provides a quick summary of the process used to arrive at the final list of variables that we are breaking down in this report. For a list of all the variables we processed, view Appendix A.
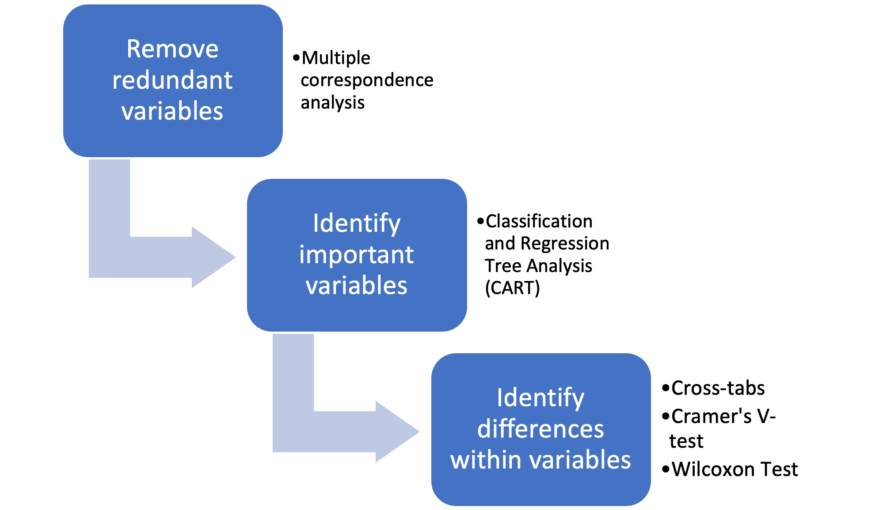
After eliminating redundant variables (variables that explain the same thing) and identifying variables that never rose to “important” we were left with the following that seem to play a larger role in each employment state of Southwest high school graduates. These variables will be the focus of this report along with more details and better definitions.
APPENDIX A – Variables
Here is the full list of variables that were initially included in our analysis before the process of elimination began.
Demographics
- Gender
- Year individual graduated high school
- Race and ethnicity
High school characteristics
- EDR of high school
- RUCA code of high school
- Average CTE intensity offered at school
- Average unemployment rate in school county
- Average wages paid in school county
High school enrollment
- Limited English proficiency
- Homeless indicator
- Free or reduced lunch eligibility
- PSEO participant
- Requires special education
- Non-english speaker at home
- Individual categorized as an English learner
High school accomplishments
- Took the ACT
- Took the AP exam
- CTE achievement
- Total CTE courses taken
- Took the SAT
- MCA scores (math, reading, science)
Post-secondary path
- Attended post-secondary right after high school
- Attended post-secondary
- Graduated from post-secondary
- Post-secondary institution sector from which they graduated
- Highest credential earned
[1] Note: the research area “Southwest” is different from the official state of Minnesota planning region Southwest. In the official planning region, Southwest is comprised of EDR 6W, EDR 8, and EDR 9. In the research area, we refer to Southwest as EDR 6W, EDR 8, and EDR 6E (instead of EDR 9).
[2] For an overview of our methodology, check out the methodology section near the end of the report.
[3] Analysis was conducted to make sure that the number of individuals that could be in multiple categories was minimal.
[4] MN Department of Education definition: https://education.mn.gov/mde/dse/cte/#:~:text=Career%20and%20Technical%20Education%20(CTE,to%20postsecondary%20education%20and%20careers.
[5] The main programs within CTE are; Agriculture, Food and Natural Resources; Business, Marketing and Information Technology; Family and Consumer Sciences; Health Science; Service Occupations; Trade and Industry; and CTE Work-Based Learning.
[6] CTE concentrator – and 9-12 grade student who successfully completes 150+ course hours as part of of a state-approved secondary CTE program within one career field.
CTE completer – any CTE concentrator who attains technical or academic knowledge and skills and graduates from high school.
CTE participant – any 9-12 grade student who successfully completes one or more state-approved CTE course(s).
[7] You can read our report on this issue here; “Changing the story on careers in rural Minnesota”; https://www.ruralmn.org/finding-work-or-finding-workers-pt-4/
[8] https://www.ruralmn.org/finding-work-or-finding-workers-pt-2/