
How the K-12 general education revenue program’s complexities work for rural districts
March 2023
By Kelly Asche, Senior Researcher
For a printable version of this report, click here.
To watch a short video about how the education formula works, click here.
To read a short blog post about the research, click here.
Increasing education funding is a topic of discussion every year at the Minnesota State Legislature. In January, Governor Tim Walz proposed a 4% increase to the basic education formula allowance within the K-12 general education revenue program, the “education formula” that determines the majority of funding school districts receive from the state.
Whenever any changes to the general education revenue program are proposed, it brings up an ongoing question—will some districts benefit more than others? From an outsider’s perspective, the funds distributed through this model can seem unequal, and in fact, they would largely be correct. Minnesota’s general education revenue program does distribute more money to some districts than others, and it is supposed to. The purpose of the program is to accomplish two things:
- Provide the same baseline of funding to each district, and
- Provide more funding to districts where, because of unique characteristics and circumstances, it costs more to educate students there.
Because the program does intentionally provide more funding to some districts than others and because of the fact that how the calculations are made is not exactly simple, increasing funding within the program has often been contentious. To help with this transparency issue, this report examines how an increase to one component of the general education revenue program—the basic education revenue formula allowance—would impact districts across the state, and in doing so, hopefully provides some insight into how the general education revenue program works. What we found is that increasing the basic education formula allowance benefits all schools. And although some schools will receive a larger increase than others, that is due to the general education revenue formula working as intended.
Note: The Center for Rural Policy & Development does not endorse any particular education funding plans or proposals. This report is only intended to provide information about the funding process to help policymakers with their decisions.
The General Education Revenue Program
Before we dive into the impacts that increasing one component of the general education revenue program would have on districts across Minnesota, let’s first learn a bit about the overarching program itself. It’s important to note that the two primary revenue streams discussed throughout this report are the general education revenue program and the basic education revenue formula allowance, which is a part of the larger program. The similar names can be confusing.
Although Minnesota’s K-12 schools get their funding from a mix of local, state, and federal funding mechanisms, Minnesota’s funding framework, the general education revenue program, makes up around a half to two thirds of the total revenue any one school district receives each year. Any changes made to this framework can have a significant impact on a district’s funding.
The general education revenue program is actually a collection of 14 formulas (called components throughout this report), each with its own purpose. Some of these formula components send revenue to all school districts, while other components may only send revenue to a few districts, and yet other components send vastly different amounts of funding to different districts depending on their unique characteristics, like location, size (in number of students or geography), facilities, and pupil characteristics.
Table 1: The 14 components of the K-12 general education revenue program and what they do.
This mix of components attempts to meet the diverse needs of students across Minnesota in two ways.
Equalization
Originally, school districts were funded through local property taxes. It became increasingly apparent, however, that “property-rich” school districts, those districts with high-value property, could collect and use a lot more revenue for their local district than “property-poor” districts, where property values were lower and therefore less revenue could be generated locally for schools. To generate the same amount of local revenue, property owners in property-poor districts would have to be taxed at a much higher rate.
Note about APU: Throughout this report you will see “APU.” This stands for adjusted pupil units which is the standard way in which much of the general education revenue program counts students. It’s not exactly 1 student equals 1 APU. Students are weighted by grade level to reflect the different educational costs at different ages.
Figure 1: If districts were just funded on a per-student basis by the state, there would be a disparity between districts with high property values and districts with low property values.
Today’s general education revenue program addresses this problem by leveling the playing field for districts. The first component in the formula, basic education revenue, provides a baseline of funding for every pupil (Figure 1). The general education formula then throws in an equalization measure (the local optional aid component and equity aid) to help property-poor districts (Figure 2).
Figure 2: One aspect of the general education revenue program is to “equalize” funding across the state.
Extra costs
The rest of the formula addresses the fact that the same K-12 education can cost more to deliver in some places than others. This additional support on top of the equalization ends up creating what looks like a disparity: some school districts receive significantly more revenue per APU than others (Figure 3).
Figure 3: Not only do some districts receive more revenue per APU from the state general education formula due to equalization, but they may receive additional support to cover the higher costs of delivering an education due to their unique circumstances.
Figure 4 shows clearly that some of our most rural districts receive the highest amounts of per-pupil revenue—particularly in northern and southwestern Minnesota—ranging from $9,000 to over $12,000 per APU.
Figure 4: Some of our most rural districts receive the highest amounts of per-pupil funding due to their geographic and pupil characteristics. Data: MN Department of Education
An example
To understand why there is such variation in revenue per APU across districts, let’s apply the general education revenue program framework and its components in more detail. Figure 5 provides each public school district’s total revenue from the general education revenue program in the Northwest planning region. This region is a good representation of the varying characteristics districts can have in terms of property values, rural- and urban-ness, and diversity in student populations. Due to this spread of characteristics, we find a wide range of per-pupil revenue totals, from a low of $7,142 per APU in Pequot Lakes to a high of $12,978 in the Grygla Public School District. Also included are school districts from the seven-county metro. This region has less variation in the dollars per APU received from the general education revenue program — Minnetonka received $6,949 per APU (lowest in the metro/state) and Minneapolis received $8,790 per APU (one of the highest in the metro).
Figure 5: School districts in Northwest MN cover a wide range of rural-ness and property types. Most districts within the seven-county metro are in the lowest category of revenue per APU from the general education program. Data: MN Department of Education
The first thing to notice about Figure 5 is that typically the districts with more high-value property in lakes regions and the Twin Cities suburbs receive less in funding than the more rural, agricultural, and inner-urban districts.[1] Part of this is due to the way the formula’s local option aid component equalizes revenue so that property-poor districts aren’t “penalized” for not being able to raise as much revenue locally as property-rich districts.
In addition, though, rural districts receiving the most revenue from the formula are also larger and serve fewer students, making them eligible for more revenue from the sparsity and small school components of the formula. With higher numbers of children from immigrant and refugee families and students on the free- and reduced-price lunch program, these districts, and the Minneapolis and St. Paul school districts, also receive extra funding through the poverty-related and English language learner components of the program.
To see how the general education revenue program is distributed in more detail, let’s compare the following districts:
- Grygla Public School District: highest revenue per APU from general education formula, $12,978.90
- Pequot Lakes Public Schools: lowest revenue per APU from general education formula, $7,142.98
- Moorhead Public School District: located in an entirely urban county, $7,784.95
- Ada-Borup Public School District: located in an entirely rural county, $8,474.33
- Minneapolis Public School District: highest revenue per APU located in Twin Cities metro, $8,790
- Minnetonka Public School District: lowest revenue per APU located in Twin Cities metro, $6,949.
These districts represent a variety of school types—a mix of rural-ness and urban-ness, property types, and student body characteristics (Figure 6).
Figure 6: These school districts in Northwest Minnesota represent a variety of rural-ness, property types and district characteristics and circumstances.
Figure 7 below shows the dollar amount from each component in the general education revenue program for each district. It highlights some of the differences across the region and how property values and rural-ness can impact the composition of the various components within the general education formula. Each color represents a different component of the general education formula. (Refer back to Table 1 for descriptions of what each component does.)
Figure 7: Although all schools receive the same amount of revenue from the basic education component, the similarities stop there. The general education formula provides revenue to meet the diverse needs of our disparate districts across Minnesota. Data: MN Department of Education
This quick comparison shows how the general education revenue program is meant to work, by providing an equal base of funding (the basic education component) for all districts, then additional support depending on the characteristics of each district.
The general education revenue composition for the Grygla Public School District shows a broad range of components. The largest components outside of the basic education revenue component are sparsity and transportation sparsity, which is due to the large, rural geographic area the district serves. It also receives a significant amount from the small schools component and a bit for local optional aid, operating capital aid, and pensions adjustment.
In Ada-Borup-West, the composition of components is a bit thinner. The district receives a bit more from the compensatory revenue stream as well as transportation sparsity and local optional aid.
In Moorhead, the big component that provides additional support is compensatory and a bit from local optional aid.
Most of Pequot Lakes’ support comes via the basic education component, with a small bit from compensatory, transportation sparsity, and pensions adjustment.
When we look at the districts from the Twin Cities area, Minneapolis gets a large amount of revenue from the compensatory component, whereas Minnetonka receives very little above the basic education revenue, a composition similar to Pequot Lakes.
The formula in action
Now that we have a better understanding of how the education formula works, we can return to a common question around school funding: does increasing only the basic education revenue component benefit certain types of schools more than others?
To find out, we put together a hypothetical scenario that increases the basic education formula allowance by 4% in Year 1 with subsequent inflationary increases for following years. Running the numbers, it appears that all schools across the state would receive a significant boost in from such a scenario.
To explain the impacts that this proposal would have, our analysis started out using the most recent data available, FY22 general education revenue program dollars and FY22 school characteristics, as a baseline (Baseline Year). In Year 1, we applied a 4% increase to the basic education revenue component as proposed, then in years 2–5, we applied a typical 3% inflationary increase each year. As in Year 1, these inflationary increases are only applied to the basic education formula allowance. At the same time, all the districts’ characteristics (enrollment, student composition, facilities, etc.) are held constant. In our analysis, the change in the basic education component would look like this over the course of those five years:
- Baseline Year: $6,728 per APU
- Year 1: $6,997 per APU (4% increase)
- Year 2: $7,207 per APU (3% inflationary increase)
- Year 3: $7,423 per APU (3% inflationary increase)
- Year 4: $7,646 per APU (3% inflationary increase)
- Year 5: $7,875 per APU (3% inflationary increase)
Figure 8 shows the results of our proposed change in the basic education revenue component. The districts that receive the largest “boost” (revenue per APU) are—again—located in northern and southwestern Minnesota.
Figure 8: By Year 5, the school districts seeing the highest dollar change in total revenue per APU are located in northern and southwestern Minnesota. Data: MN Department of Education
This may raise a question: If the proposal is to increase just one component of the general education revenue program—a component where everyone gets the same dollar amount per APU—why is there such a difference among school districts after five years? If only the basic education component is being adjusted, shouldn’t all districts receive the same?
The linked components: Recognizing differences
The answer is, “No,” and that is because there are four components in the general education program directly linked to the basic education component—in other words, these five components (Figure 9) all move together. As was mentioned early on, the goal of the general education revenue program is not to provide every school district with equal funding, but to provide all districts with enough funding to give their students equal educational opportunities, regardless of where those students live in the state or their income or family circumstances. When funding in the basic education component goes up, these linked components do as well—maybe. These four components—basic skills–compensatory; declining enrollment; sparsity; and transportation sparsity—are calculated based on a district’s characteristics. Basic education is the largest of the components, but as we saw above, the other four can be significant to a district, too (Figure 7).
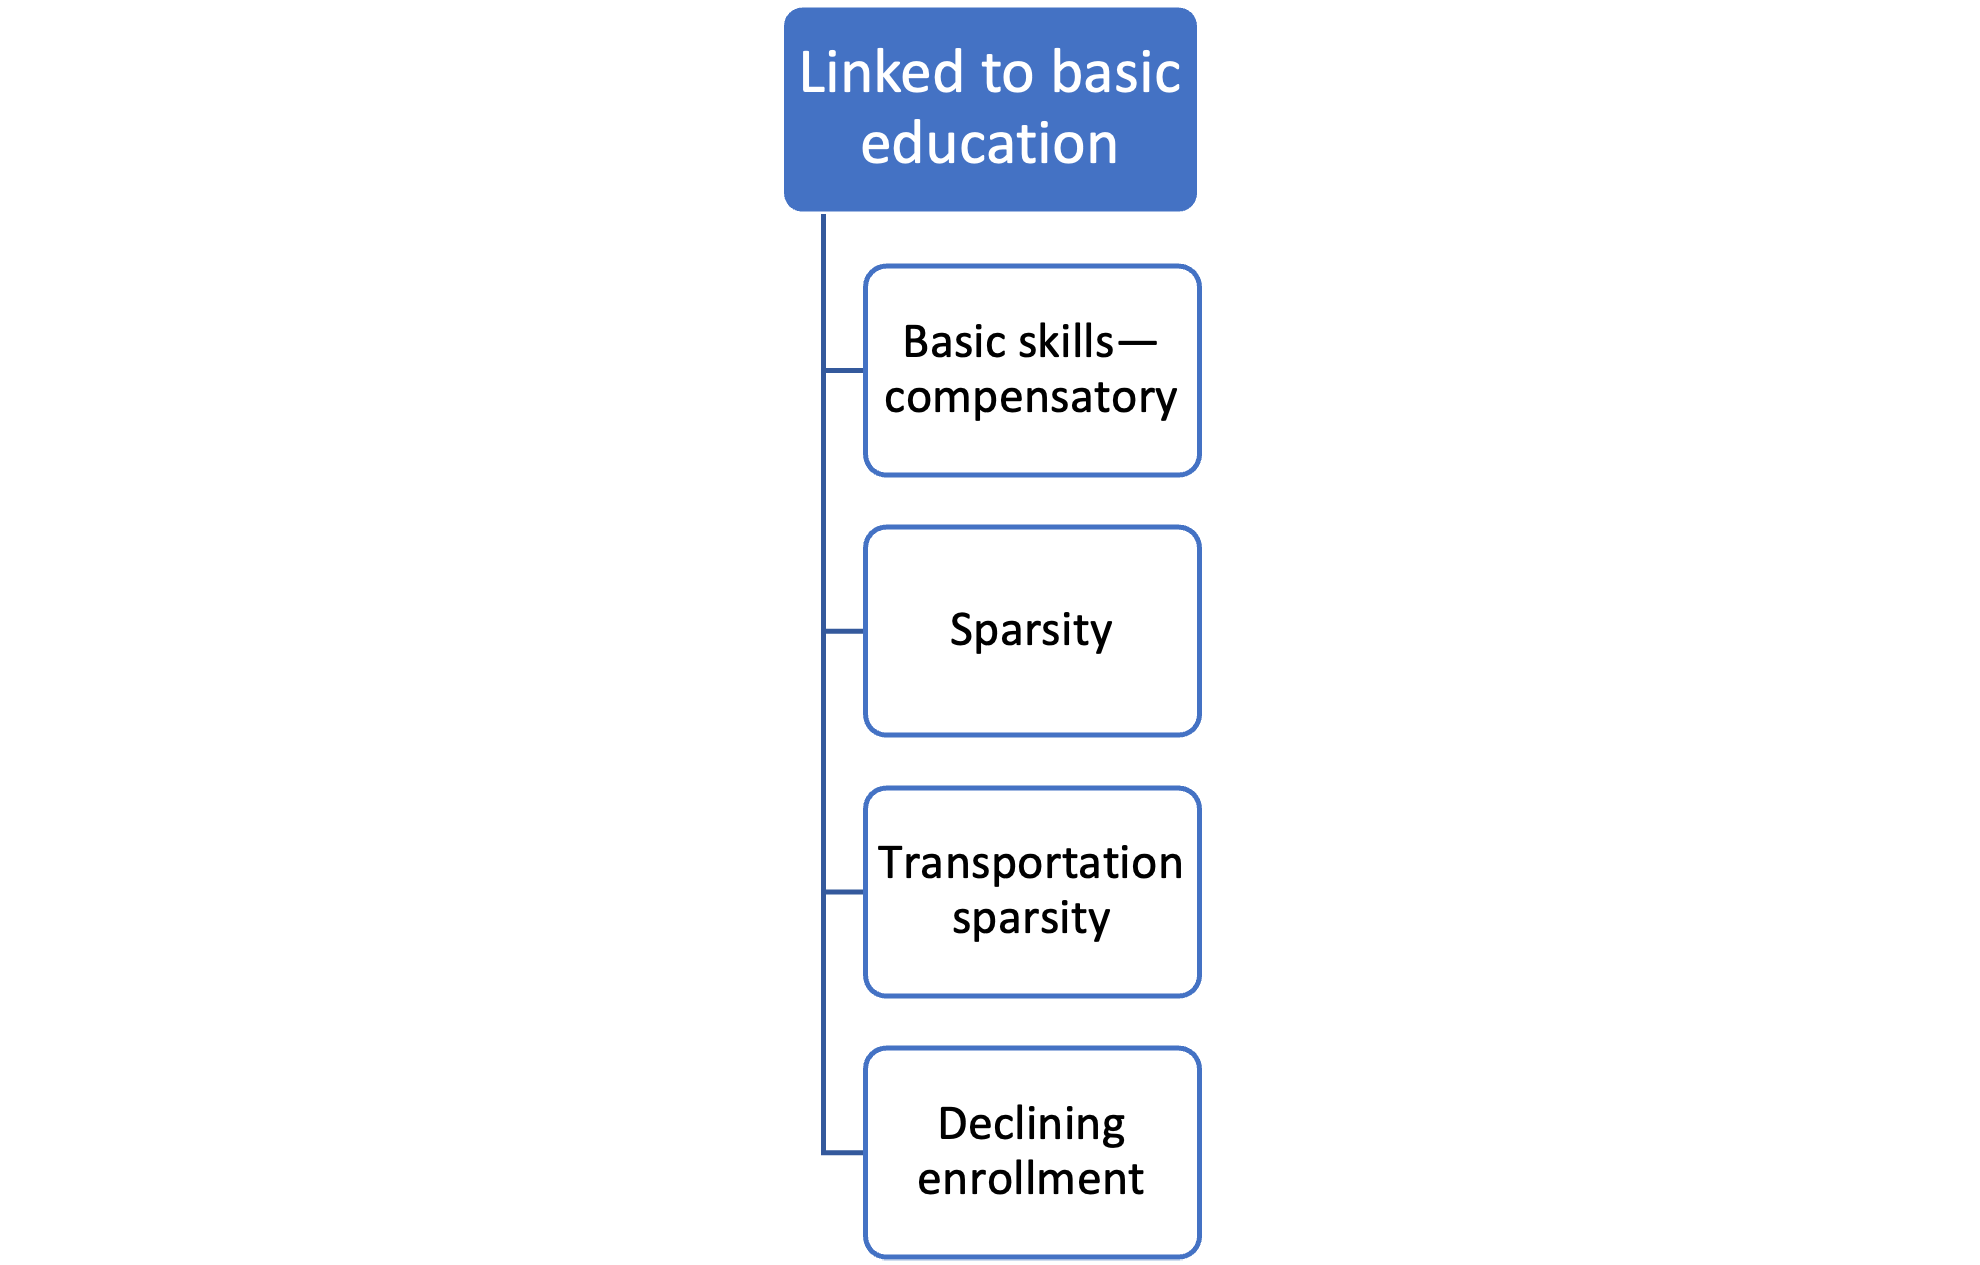
Figure 9: These five components within the general education revenue program are linked, increasing when the basic education formula allowance increases.
Together, these five components make up most of the total revenue coming from the general education revenue program. For all of Minnesota in FY22, in fact, 94% of the entire general education formula funding came from these five components. By district, it accounted for anywhere from 85% (Butterfield Public School District) to 99% (Crosby-Ironton Public School District) of funding from the program (Figure 10). Therefore, increasing the basic education revenue component results in substantial increases in total state revenue for every district, as Figure 8 showed.
Figure 10: The basic education revenue allowance and the components linked to it make up the vast majority of any district’s formula funding: 85% to 99% of general education formula revenue for the state’s various districts Data: MN Department of Education
As an example, let’s look in more detail at the Belgrade-Brooten-Elrosa Public School District. Figure 11 shows the funding in the Baseline Year (solid bars) for each component and how increasing the basic education revenue component increases the revenue from the other linked components (the shaded bars). The five linked components (blue) account for four of the district’s top five revenue sources within the general education revenue program and provide 91% of the district’s total Baseline Year general education revenue; by Year 5, they would account for 93%.
Figure 11: For the Belgrade-Brooten-Elrosa school district, an increase to the basic education formula allowance provides an increase to four of the top five components that contribute to their general education revenue program.
The linked components in action
The worry that only increasing one piece of the entire program, the basic education formula allowance, would unfairly shift program funding away from some districts to others is reasonable, but if we review the linked components and the issues they’re addressing, we can see that each one has a purpose, and if one district gets more funding than another, it’s because that funding is addressing a specific issue there.
|
The basic education revenue component is the starting point. This component ensures that every district has the same baseline funding. By YEAR 5 (in our analysis), the basic education formula allowance would provide $7,875 per APU to every district (Figure 12). |
Figure 12: Every school district gets the same revenue per APU from the basic education revenue component. Data: MN Department of Education
|
|
|
Figure 13: Compensatory revenue per APU is highest in many rural school districts and Minneapolis and St. Paul. Data: MN Department of Education |
Compensatory provides additional funding to districts based on the percentage of students that are eligible for free and reduced-price lunch (Figure 13). |
Figure 14 shows the large variance in compensatory revenue per APU provided to districts. Minneapolis serves a significantly larger proportion of students that are eligible for free and reduced-price lunch, which is why the compensatory funding the district receives is so much higher.
Figure 14: The proportion of the student body that is eligible for free and reduced-price lunch varies considerably across Minnesota districts. Data: MN Department of Education
|
The sparsity revenue component provides additional funding to districts that serve large geographic areas but not a lot of students. This component helps with the second goal of the general education revenue program, to help districts that can’t achieve the economies of scale of densely populated districts (Figure 15). |
Figure 15: Most districts don’t receive sparsity revenue, but the ones that do are located mostly in northern and western Minnesota. Data: MN Department of Education |
Figure 16 shows that sparsity revenue goes to a few districts that meet specific criteria. In the case of our examples, only Gyrgla meets that criteria.
Figure 16: Gyrgla receives additional revenue to help meet the economies of scale that other districts can achieve. Data: MN Department of Education
|
Figure 17: Transportation sparsity revenue is highest per APU in northern Minnesota and a bit higher in western Minnesota. |
Transportation sparsity provides additional funding to help schools with the higher expenses of transporting students over large geographic areas. This component meets the second goal of the general education revenue program (Figure 17). |
Figure 18 shows that the more rural a district is, the more likely it receives higher transportation sparsity revenue per APU. The districts in the seven-county metro receive no funding for transportation sparsity.
Figure 18: Transportation sparsity largely goes to rural districts. Data: MN Department of Education
|
The declining enrollment revenue component provides additional support to districts that experienced a loss in enrollment from the previous year (Figure 19). |
Figure 19: Declining enrollment is an issue for school districts all across the state. Data: MN Department of Education |
Figure 20 shows that the Minneapolis school district receives the most revenue per APU for declining enrollment. Grygla was the only other district in the example group that had enrollment declines.
Figure 20: Many people think that declining enrollment component benefits rural districts only, but it actually helps schools across rural and urban Minnesota. Data: MN Department of Education
All the maps above show that the linkages between the basic education formula allowance and the five general education revenue program components provide extra revenue to districts facing unique situations and circumstances, which is what the program is designed to do. Some districts receive higher amounts per APU than other districts in order to meet those needs. And since the basic education formula allowance is linked to these, an increase in that allowance means an increase in the other four linked components.
One note of caution, however: Adjusting complex programs such as the general education revenue program can cause issues if not done correctly. Our analysis found that continued increases to only the basic education revenue component will eventually throw out of whack the components that aren’t linked to the basic education component. At some point, tweaks will need to be made to the formula, but over the course of five years, the formula appears to work as intended.
Conclusion
The general education formula isn’t meant to be simple—it’s complex for a reason. And yes, because of its complexity, at first glance it would seem to provide funding unequally across the state. Yet, it’s important to keep in mind the formula’s primary goal, which is not to equalize funding among all the districts, but to equalize educational opportunities, which can require more per-student funding in some districts than others.
When answering the question as to whether some districts receive a significant boost compared to other districts from an increase in the formula’s central basic education formula allowance, the simple answer is “no.” Our analysis indicates that even though some districts would receive a larger boost than others, all districts would receive a significant boost. The components linked to the basic education formula allowance address the characteristics that make it more expensive to provide education in some districts than others, and together, these components provide the bulk of the funding from the program. Therefore, although some districts would receive more than others through such an adjustment, these differences only address the reality of providing education in Minnesota today.
Footnotes
[1] Property values for agricultural land in Minnesota can be very high right now, but only in certain parts of the state, and some of that value is excluded from property tax calculations for education funding. (Check out this report on the rise in ag land values.) https://www.ruralmn.org/stratosphere-farmland-and-its-growing-impact-on-rural-tax-bases/