
The USDA – ERS has released the new Rural-Urban Continuum Codes for each county.
Kelly Asche, Senior Research
April 2024
People love classifications—the ability to split things into separate, distinct groups makes them easier to measure, providing some clarity when creating policy. Although we agree that most classifications aren’t perfect, we also don’t give enough consideration to how these classifications can have their own dynamics.
For example, the classifications “rural” and “urban” have many formal definitions: USDA’s Rural-Urban Commuting Areas (RUCA), U.S. Budget and Management’s Rural and Metro, and U.S. Census Bureau’s Metropolitan and Micropolitan are just a few examples. Each of these will provide different population numbers, median incomes, employment rates, etc., because these classification systems consider different areas to be rural or urban. And not only do these classifications define rural and urban areas differently, the formulas used within each classification can change as well, adding another wrinkle when measuring change over time.
Changes to RUCC
The most recent classification to update its definitions is the USDA’s Rural Urban Continuum Codes (RUCC). “The 2023 Rural-Urban Continuum Codes distinguish U.S. metropolitan (metro) counties by the population size of their metro area, and nonmetropolitan (nonmetro) counties by their degree of urbanization and adjacency to a metro area.” You can find the documentation on their methods here.
In previous years, the classification codes were defined as:
Table 1: The 2013 RUCC classification. Source: USDA, Economic Research Service, using data from the Office of Management and Budget and U.S. Department of Commerce, Bureau of the Census.
|
Code |
Description |
|
Metro counties: |
|
|
1 |
Counties in metro areas of 1 million population or more |
|
2 |
Counties in metro areas of 250,000 to 1 million population |
|
3 |
Counties in metro areas of fewer than 250,000 population |
|
Nonmetro counties: |
|
|
4 |
Urban population of 20,000 or more, adjacent to a metro area |
|
5 |
Urban population of 20,000 or more, not adjacent to a metro area |
|
6 |
Urban population of 2,500 to 19,999, adjacent to a metro area |
|
7 |
Urban population of 2,500 to 19,999, not adjacent to a metro area |
|
8 |
Urban population of fewer than 2,500, adjacent to a metro area |
|
9 |
Urban population of fewer than 2,500, not adjacent to a metro area |
One of the changes made in the updated RUCC classification is the population threshold of a geography when classifying within the nonmetro category.
“Changes in the criteria used to define urban and metro areas over time has reduced the comparability of the Rural-Urban Continuum Codes over each of the past five decades. For the 2023 version, the threshold for urban area population was raised from at least 2,500 to 5,000 people, reflecting changes to urban area qualification introduced by the U.S. Census Bureau in 2020.”
Essentially, this means that instead of a population being 2,499 or less to be considered a specific RUCC category, the population is now 4,999 or less. This will mean that when geographic places are assigned a change in their RUCC code, that change may be related to not only changes in their populations, but also which version of the population thresholds are being used to calculate the categories: 2013 or 2023? Table 2 shows in bold where the thresholds have been changed.
Table 2: The 2023 RUCC classification definitions have changed slightly (bolded numbers). Source: USDA, Economic Research Service using data from the Office of Management and Budget and U.S. Department of Commerce, Bureau of the Census.
|
Code |
Description |
|
Metro counties: |
|
|
1 |
Counties in metro areas of 1 million population or more |
|
2 |
Counties in metro areas of 250,000 to 1 million population |
|
3 |
Counties in metro areas of fewer than 250,000 population |
|
Nonmetro counties: |
|
|
4 |
Urban population of 20,000 or more, adjacent to a metro area |
|
5 |
Urban population of 20,000 or more, not adjacent to a metro area |
|
6 |
Urban population of 5,000 to 19,999, adjacent to a metro area |
|
7 |
Urban population of 5,000 to 19,999, not adjacent to a metro area |
|
8 |
Urban population of fewer than 5,000, adjacent to a metro area |
|
9 |
Urban population of fewer than 5,000, not adjacent to a metro area |
Comparing geographical categories
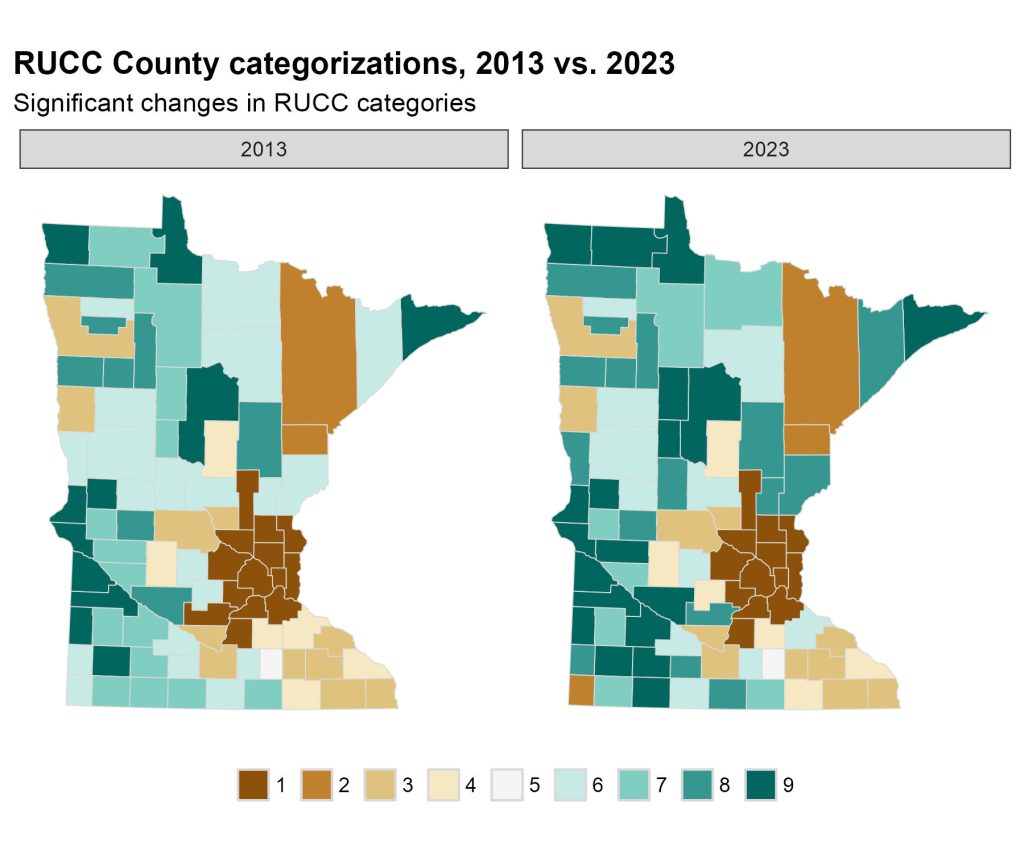
The maps below compare the classifications from 2013 and 2023 for each county. The 2013 map provides each county’s 2013 classification using 2010 population data. The 2023 map provides each county’s 2023 classification using 2020 population data. We can see that quite a few counties in north central, northwest, and southwest Minnesota are classified more rural in 2023 compared to 2013.
Figure 1: The map on the left categorizes counties using the 2013 RUCC definitions and their 2010 populations. The map on the right categorizes counties using the updated 2023 RUCC definitions and their 2020 population. Source: USDA, Rural Urban Continuum Codes (2013 & 2023)
A total of 22 counties saw shifts in their RUCC categories from 2013 to 2023; 19 of the 22 counties shifted to being categorized as more rural (19 counties).
Table 3: These counties’ rural-urban designations shifted due to changes in the 2023 RUCC categories compared to the 2013 categories. Source: USDA, ERS, RUCC categories
The problem here is that we actually can’t compare across time due to the change in the way categories are defined. So this means that some counties changed categories because their populations changed, while some categories changed because the definition changed.
Example: Cottonwood County
Let’s use Cottonwood County as an example. In 2013, Cottonwood County was categorized as RUCC – 7 with a population of 11,687. By 2020, it was recategorized as a RUCC – 9, yet its population is nearly identical: 11,517. Why is it being designated as “more rural”?
The reason is due to the increase in the population threshold and the population of the communities within the county. Cottonwood has six communities, or “urban populations”: Windom, Bingham Lake, Mountain Lake, Storden, Jeffers, and Westbrook. According to the new 2023 RUCC definitions, if a county has an urban population (people in a city or population center) of fewer than 5,000 and isn’t adjacent to a metropolitan county, it’s categorized as 9. And the only community in Cottonwood County that comes close to that is Windom, with a 2020 population of 4,742 people.
However, in 2013, the population threshold for RUCC–9 was under 2,500 people, and the 2010 population of Windom was 4,646, too high to be categorized as a 9; it was instead designated a 7. If the threshold hadn’t been increased in 2023, it would still be RUCC–7.
This is the case with nearly all of these differences in categorizations from 2013 to 2023—it’s largely due to the increase in the urban population threshold, which in effect made more counties more “rural.”
So, why does it matter? Well, it means that we have to be very careful when comparing RUCC populations over time. Changing each RUCC table every ten years means you are changing the designation of actual places not because they experienced any growth or loss but because the definition changed, and therefore, lists of places, for example, designated RUCC – 9 in 2003, 2013, and 2023 are not the same, even though their underlying population numbers barely changed. It’s just another wrinkle in the ongoing conversations around what is urban and what is rural.