
Pandemic paints a different employment picture in rural Minnesota
January 2021
By Kelly Asche, Research Associate, & Marnie Werner, Director of Research
For a printable version of this report, click here.
Our podcast episode diving deeper into this research can be found here.
On January 21st, 2021 we hosted a webinar presenting this research as well as interviewing workforce specialists in rural Minnesota. Click here to view that webinar.
To read our previous research on rural workforce shortages, click here.
During the initial phase of the public health response to COVID-19 (March 2020), officials expected unemployment to increase significantly as businesses and schools across the state shut down or severely limited their operations.
Ten months later, however, while unemployment continues to be a top concern of government officials, the employment landscape varies quite a bit depending on location. Workforce data shows that unlike a normal recession, where joblessness is widespread across all sectors of the economy, unemployment this year has been concentrated in specific occupations and occupation groups. [1]
At the same time, in most of Greater Minnesota, jobs across a wide range of occupation groups still sit unfilled, not because workers have been laid off, but because employers in many rural areas are still searching for workers with the needed skill sets.
As state lawmakers begin the work of recovering economically from the pandemic, they are presented with a unique opportunity, one that doesn’t come around very often: a large pool of unemployed workers and a large selection of jobs that need filling.
The pandemic’s impacts on workers: Unemployment and dropping out of the labor force
The question now is, “How much impact has the pandemic had on these workforce trends?”
It depends, of course. Unemployment claims spiked when non-essential businesses were shut down in March (Figure 1), followed by another smaller spike in November, when restaurants, bars and other venues were shut down to control an upsurge in COVID-19 cases.
Figure 1: The number of weekly unemployment claims in 2020 as a percentage of total employment for the year 2019 shows a spike in the spring during the shutdown of non-essential businesses, then slowly decreases over time with a small uptick in November. Data: MN Dept. of Employment & Economic Development (DEED), Unemployment Claims; Bureau of Labor Statistics, Occupational Employment Statistics
The unemployment data shows that over the course of 2020, the bulk of unemployment claims in Minnesota, regardless of region, fell into two groups: i) occupations in businesses impacted by the pandemic, and ii) seasonal occupations. Up until September, the majority of UI claims across the state resulted from the pandemic and mostly impacted four occupation groups in Minnesota: food prep and serving-related jobs; sales and related jobs; office and administration jobs; and health care support (Table 1). In the Twin Cities seven-county region, management and transportation and material moving were also impacted. These job losses were a direct result of the changes in shopping behaviors, decline in revenue and closures of businesses caused by the pandemic.
Table 1: Occupation groups with the top-five highest weekly unemployment claims from April through November. The value is the weekly average UI claims. Occupation groups highlighted in red are considered to be impacted by the pandemic whereas the green occupation groups have high unemployment claims likely due to seasonal nature of the work. Data: MN DEED, Continuous Unemployment Insurance Claims
| Rank | Northwest | Northeast | Central | Seven-county Mpls-St Paul | Southwest | Southeast |
|---|---|---|---|---|---|---|
| 1 | Food Preparation and Serving Related | Food Preparation and Serving Related | Food Preparation and Serving Related | Food Preparation and Serving Related | Food Preparation and Serving Related | Food Preparation and Serving Related |
| 2 | Production | Construction and Extraction | Production | Sales and Related | Production | Production |
| 3 | Sales and Related | Sales and Related | Construction and Extraction | Office and Administrative Support | Sales and Related | Sales and Related |
| 4 | Construction and Extraction | Office and Administrative Support | Sales and Related | Management | Office and Administrative Support | Office and Administrative Support |
| 5 | Office and Administrative Support | Healthcare Support | Office and Administrative Support | Transportation and Material Moving | Construction and Extraction | Construction and Extraction |
Unemployment claims filed since September, though, are more likely to represent layoffs related to seasonal work, occupations that would typically experience higher unemployment claims during the winter months anyway. Due to the seasonal nature of employment for many industries in rural areas, a majority of the growth in unemployment claims after September are typical for Greater Minnesota in the fall. So, despite closures in the restaurant and entertainment sectors, by November unemployment rates in rural areas were not substantially different from what they were in 2019 (Figure 2).
Figure 2: Comparing the difference between unemployment rates for 2019 and 2020 shows how much higher rates were in early summer 2020 during the peak of the pandemic compared to the same months in 2019. Data: MN DEED, Local Area Unemployment Statistics
Unemployment doesn’t provide a complete picture of how the pandemic has impacted the workforce, however, since unemployed individuals are still considered a part of the labor force. There has been considerable concern that the decreases in the unemployment rate are partially driven by individuals dropping out of the labor force altogether.
Figure 3 shows the change in the number of individuals participating in the labor force indexed to January 2019 and January 2020. It’s apparent that growth in labor force participation in 2020 was not only consistently below that of 2019, but it was also negative for most regions of the state throughout the year. The most severe cases appear to be in Northeast Minnesota and the Twin Cities metro.
Figure 3: Since the number of people participating in the labor force fluctuates throughout the year, it’s best to compare the fluctuation rather than the numbers. This chart shows that in 2020 the number of individuals participating in the labor force indexed to January 2020 is significantly lower across all of Minnesota compared to the index in 2019. Data: MN DEED, Local Area Unemployment Statistics
The correlation between declines in unemployment rates and labor force participation also shows up when we compare the two. Figure 4 provides the average number of weekly unemployment claims each month and the monthly change in labor force participation. For much of the state, we can see where unemployment dropped and labor force participation rose in May and June, suggesting that people were going back to work. In the middle of the year, though, both unemployment and participation in the labor force trended downward, indicating that the decline in unemployment was due this time to people dropping out of the labor force.
Figure 4: In the second half of 2020, unemployment claims declined along with people participating in the labor force, indicating that dropping unemployment rates are partially due to people dropping out of the labor force altogether.
Specialists with workforce development organizations and dislocated worker programs give multiple reasons for the growing number of individuals dropping out of the labor force, most of them created by the unique environment of the pandemic. Many workers on unemployment fear going back to jobs that put them in frequent contact with people, as in the case of restaurant serving staff, sales associates and other customer service-related occupations. Life turmoil created by the pandemic is also a factor: kids home from school, reduced childcare availability, and the elimination of other services that help people be productive at work have forced many people to choose to not work at all rather than stay in the labor force. Once they leave the labor force, they are no longer counted in the unemployment rate.
Pandemic’s impact on jobs: Job vacancies are still a thing
Despite the loss of jobs around the state, however, for those businesses already experiencing a workforce shortage, things haven’t changed much. Figure 5 shows that region by region, job vacancy rates September through November were about 2 to 3 percentage points lower than their average rates for 2019.[2] But although vacancy rates are a bit lower than in 2019, they are still historically high, especially in rural Minnesota, and therefore do not indicate any less pressure to find workers.
Figure 5: The average job vacancy during September and November 2020 shows job vacancy rates 2 to 3 percentage points lower than the 2019 annual vacancy rate. Data: MN DEED: National Labor Exchange, Occupational Employment Statistics, and National Labor Exchange Job Postings
Job vacancy rates in rural Minnesota have been climbing steadily since 2008 (Figure 6) and until this spring were considerably higher than the 4.7% vacancy rate in the Twin Cities seven-county metro. In addition, the number of job vacancies in rural Minnesota offering health insurance benefits and full-time hours were at all-time highs in 2019, while median wages for job vacancies were growing fastest in regions outside the Twin Cities.
Figure 6: Job vacancy rate is the average number of job vacancies each quarter as a percentage of total jobs in the region. The highest vacancy rates are found in rural Minnesota. Source: MN DEED – Job Vacancy Survey.
These high vacancy rates were the result of a number of factors: demographic changes (retirements), economic growth, and an ongoing lack of available workers with applicable skills. For more on the rural worker shortage, its implications, and efforts by workforce development organizations to attract more workers, see our previous research on rural Minnesota’s workforce shortage.[3]
Figure 7: The number of weekly job postings as a percentage of weekly unemployment claims rose steadily into October, then began dropping off again due to the increase in unemployment claims. Vacant job numbers stayed relatively steady. Data: MN DEED Unemployment Claims & National Labor Exchange
By the fourth quarter of 2020, the number of new job postings was already close to equaling or even surpassing the number of new unemployment claims in several parts of rural Minnesota (Figure 7).
However, since the end of October, those percentages have decreased significantly. Although at first glance it might look like increasing COVID-19 cases and the subsequent restrictions put in place in mid-November impacted the number of jobs available, this wasn’t the case, at least through November (the most recent data available). The ratio of new job vacancies to new unemployment claims did drop, but only because unemployment claims increased. The number of job postings in each region stayed roughly the same or even increased throughout November. In addition, the increasing unemployment rate in rural Minnesota was largely due to seasonal changes, particularly in occupations that were expected to see a drop in employment due to the upcoming winter season anyway.
An opportunity and a problem
This situation in rural areas leads to a unique opportunity that workforce development organizations haven’t seen for quite some time: a growing supply of available jobs and a pool of available workers.
The current ratio of open jobs to available workers is significantly better than in previous years, when the ratio of job postings to unemployed workers was close to 1 to 0.5, or two open jobs for every one unemployment claim filed. But the current situation presents a problem: while unemployment statewide is concentrated in the same small number of occupation groups—services, hospitality—job vacancies are spread across many occupation groups and vary by region. Therefore, a majority of the individuals currently unemployed were not employed in the sectors that need workers, and so they almost certainly do not have the skill sets required for the in-demand jobs. [4]
Figure 8: Since the beginning of September, regions in rural Minnesota (except for Central) have had an increasing number of occupation groups with more job postings than unemployment claims. Data: MN DEED, National Labor Exchange; Continuous Unemployment Insurance Claims
Rural regions of Minnesota continue to have workforce shortages in a significant number of occupation groups. By the end of November, rural Minnesota (except for Central) had the highest number of occupation groups with more job postings than unemployment claims (Figure 8).
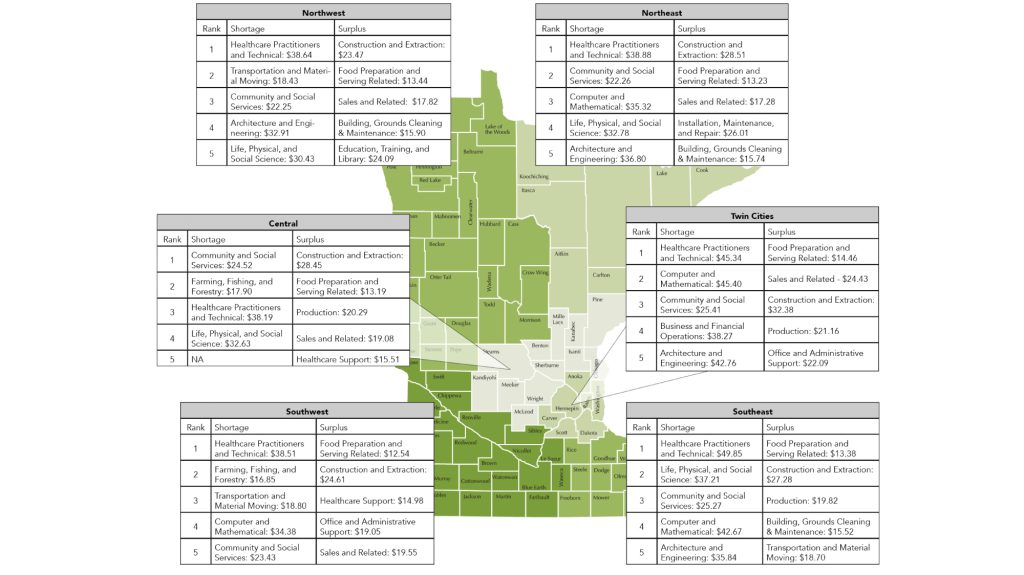
Lining up the occupation groups most in need of workers alongside the occupation groups with the largest surplus of workers (Figure 9) shows the mismatch.
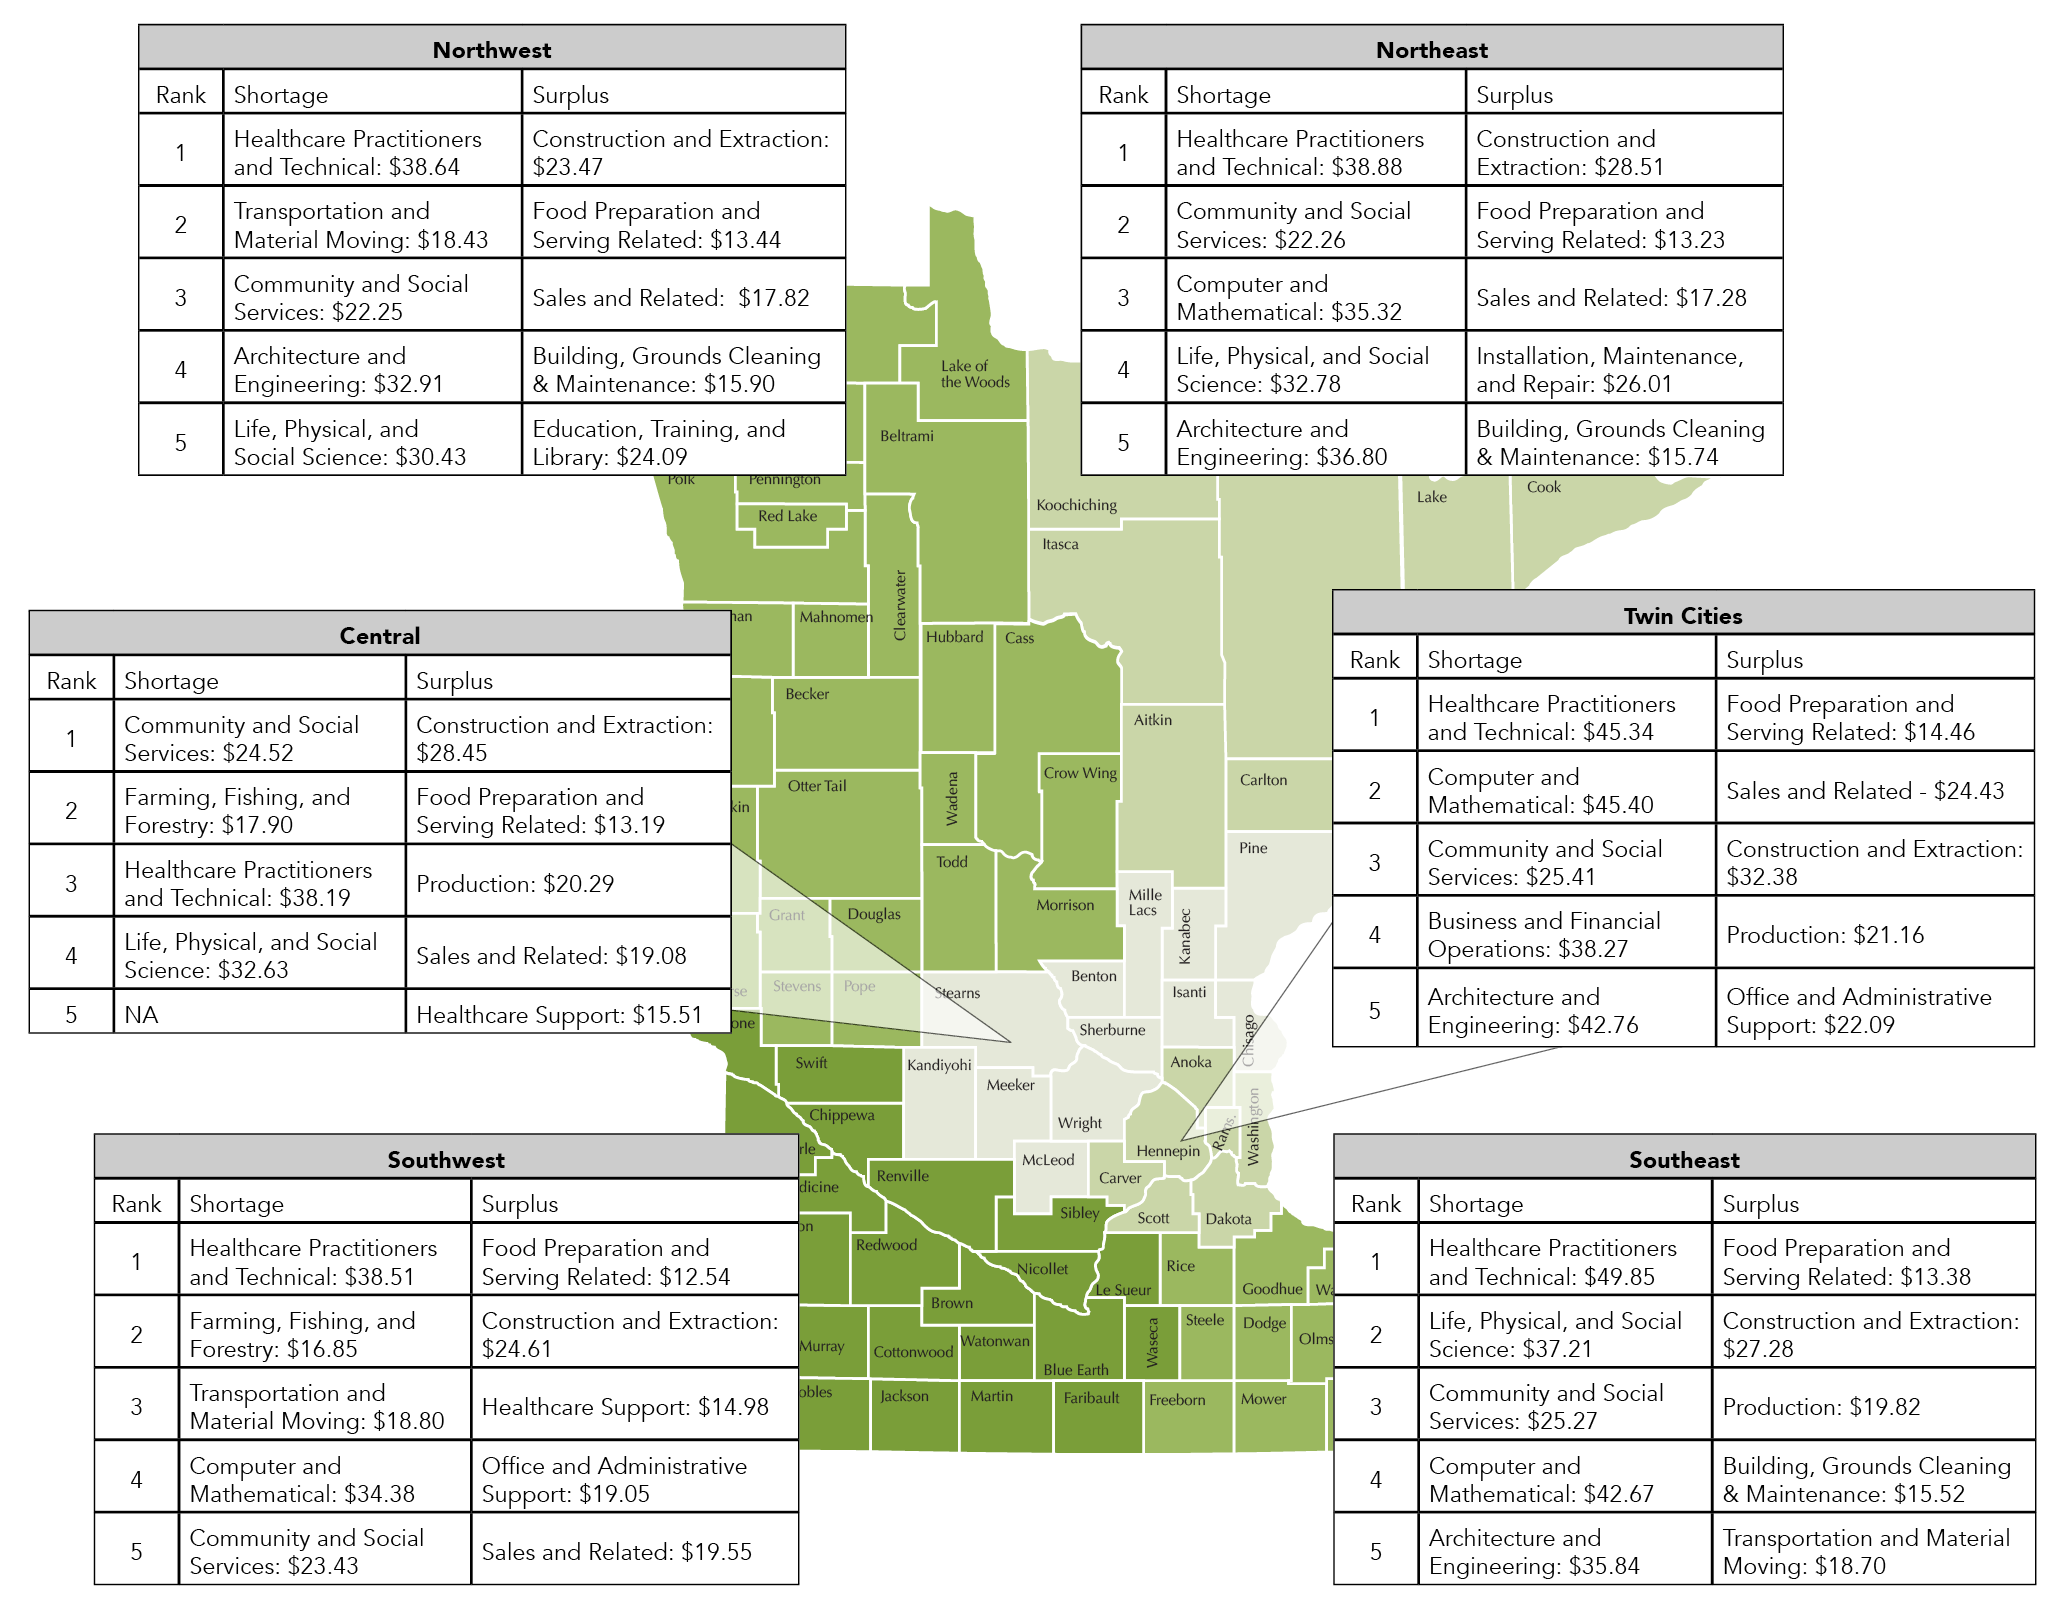
Figure 9: The top five occupations currently experiencing workforce surpluses are pretty common across all of Minnesota. The top occupational groups experiencing workforce shortages varies a bit more according to region (except for healthcare) and all require significant retraining or education. Tables include average hourly wage. Data: MN DEED, National Labor Exchange, Continuous Unemployment Claims
Healthcare practitioners and technical occupations showed up in the top-five occupation groups with the largest worker shortages in all 13 economic development regions, while community and social services occupations showed up in the top five in 10 out of 13 EDRs. On the worker surplus (unemployed) side, construction and extraction showed up in the top-five occupation groups in all 13 regions, while food prep and serving-related occupations showed up in the top five in 10 EDRs.[5]
To complicate matters, however, there can be a shortage and a surplus of jobs within each occupation group. Each of the 23 occupation groups encompasses hundreds of specific occupations, and each region differs as to whether it has a surplus or shortage of workers for a given occupation. For example, in Table 2 the production group shows a worker shortage in five EDRs and a worker surplus in six EDRs, indicating that occupations within the production group differ by whether they need workers or not within each region.
Unemployed workers looking for jobs in sectors with a worker surplus will have a difficult time as they find themselves competing with other workers for fewer jobs. Job forecasts also indicate that this situation may not be temporary: the same occupation groups with high unemployment rates at the end of 2020 are in fact projected to continue to shed jobs over the next five years.
An analysis done for CRPD by RealTime Talent shows that although the pandemic’s initial shock to the economy was severe, by 2025, the total number of jobs in each region should recover to the point of being only 1% to 2% lower than projections made before the pandemic (Figure 10).
Figure 10: These charts provide the historical number of jobs in each region followed by the projected number of jobs before the pandemic hit and the current projected number of jobs post-pandemic. Source: RealTime Talent analysis of ChmuraJobsEQ forecast data.
Importantly, though, that projected gap will be caused largely by future job eliminations in the sectors that were most impacted by the pandemic. In other words, those occupations experiencing the largest number of unemployment claims this year—food preparation and serving-related, sales-related, and office and administrative support—are projected to have workforce surpluses over the next five years, indicating that people looking for new jobs in these fields may have difficulty finding them in the coming years.[6]
Table 2 provides a list of the occupational sectors projected to face workforce shortages over the next five years in at least one EDR. If these open jobs are to be filled, unemployed workers will need access to retraining, and strategies to retrain unemployed individuals will have to be specific to each region’s diverse workforce needs.
Table 2: Occupation groups projected to face a workforce shortage over the next five years in at least one EDR, the number of EDRs that shortage is projected in and its expected severity.
Source: RealTime Talent, JobsEQ
| Occupation Categories | Number of EDRs where occupation is projected to face a workforce shortage (EDR 11 – Metro excluded) | Rank of workforce shortage severity (1 most severe, 11 least severe) |
|---|---|---|
| Healthcare Practitioners and Technical | 12 | 1.1 |
| Management | 12 | 1.9 |
| Community and Social Service | 12 | 4.3 |
| Business and Financial Operations | 11 | 3.3 |
| Computer and Mathematical | 11 | 5.5 |
| Architecture and Engineering | 11 | 7.3 |
| Life, Physical, and Social Science | 10 | 8.5 |
| Installation, Maintenance, and Repair | 8 | 7.8 |
| Legal | 8 | 10.1 |
| Healthcare Support | 7 | 7.4 |
| Construction and Extraction | 6 | 5.5 |
| Educational Instruction and Library | 4 | 9.0 |
Complexity for workforce development organizations
Although the slightly higher unemployment numbers in rural Minnesota and the significant number of people dropping out of the labor force is concerning, workforce development organizations, whose mission it is to connect people with jobs, see the situation as an opportunity. It’s been years since employers in these regions have had a pool of available workers to draw from. Of course, the most challenging aspect is how to coax these individuals back into the labor force and get them trained for positions that are in demand. Interviews with workforce development organizations reveal the complexity the pandemic has added to this situation.
Connecting workers to local services. A significant source of frustration among workforce development organizations are the challenges in engaging with dislocated and unemployed individuals due to the pandemic. Previously, individuals filing for unemployment would be directed to their local office of the MN Department of Employment and Economic Development’s workforce division, CareerForce, for an orientation. There they would learn about the resources being offered by their local workforce development council and other organizations, including retraining opportunities. This touchpoint was an important step in connecting local workforce organizations to unemployed workers since the organizations don’t receive information about individuals and therefore cannot contact them directly. In the process used this year, however, people filing for unemployment are directed to a contact point in St. Paul for information on retraining rather than to their local workforce development organization.
Although significant credit goes to MN DEED for quickly setting up a new system to connect with unemployed individuals virtually, without the in-person orientations, there is still an inevitable lack of local communication. Due to this, workforce development organizations are concerned over the low numbers of dislocated workers using their services since unemployment is a bit higher and the number of individuals leaving the labor force has increased significantly since this spring. They feel that many dislocated workers are still not aware of the local re-employment services they are eligible for.
Broadband is an issue. Many workforce organizations have shifted their programming to virtual formats. Although this theoretically should increase access for individuals since it eliminates any travel necessary to attend, they have noted many instances where the individuals don’t have the technical literacy or technology access to partake in these services.
Timing is also an issue. Many of the workforce development organizations are expecting a large influx of individuals seeking their services once the pandemic is resolved. Some individuals on unemployment are likely choosing to remain unemployed rather than risk entering into employment, particularly in occupations that require significant contact with customers. In addition, the many people that have left the labor force due to reasons caused by the pandemic may likely seek employment once they feel it’s safe and society has resumed some sort of normalcy. All of these trends point toward this summer when a significant number of individuals will seek employment once again and will utilize workforce development services en masse. This is especially relevant because…
Workforce development organizations are already stretched thin. Workforce development as a field has two sides: the unemployed looking for work, and the employers looking for workers. Before the pandemic, our rural workforce development organizations were largely engaged with employers due to the high demand for workers and the low number of unemployed. Now with a higher number of workers unemployed and a high number of people dropping out of the workforce, their attention has to be in two places. Not only are they still engaging employers, but they will also need to assist unemployed workers. This has organizations stretched thin. The workforce development system in Minnesota must prioritize the unemployed over employers, but many workforce development organizations say that may not meet the needs of the current situation. Right now, due to both unemployment and the number of jobs available, both sides are just as important, and therefore having state funding and programming to do both is vital for today and the future.
Conclusions and recommendations
The data are clear: aside from high unemployment in a handful of occupation groups in the food prep and serving-related, sales-related, and office and administrative support fields, the workforce shortage that has plagued rural employers for the past ten years continues.
But now we have an opportunity: a group of unemployed people who will be looking for work when the pandemic is over or sooner, and a group of employers looking for people to fill well-paying jobs. The only hiccup in the system is the skills gap. The occupations projected to face the most severe workforce shortages all require extensive training, and the currently unemployed workers do not have those skills.
So, what do Minnesota’s workforce councils offer in retraining opportunities, and how could those opportunities be improved? What changes need to be made to adapt to this new scenario? What opportunities are there for unemployed workers in the Twin Cities to come to Greater Minnesota to fill jobs, and how do employers and their communities get the word out?
These are all questions that need to be answered if we are going to use this new opportunity to its best advantage.
Recommendations for consideration
- Any new programming or funding should provide local workforce development organizations the flexibility to meet the diverse needs of their regions. For example, no competitive grant programs with strict eligibility guidelines that unintentionally but automatically disqualify rural workforce development organizations.
- Provide support to local workforce development organizations to help them connect with employers in their communities. Right now, workforce development organizations are “customer-focused,” meaning the funds they receive can only be used to connect with and assist unemployed people. But in most rural areas, there is also value in connecting with their local businesses to help these employers connect with potential workers, including through their own in-house retraining programs.
- Provide resources for programs that help unemployed individuals purchase the equipment they need to communicate with workforce development organizations and/or DEED and to participate in online retraining programs and other re-employment resources.
- Find ways DEED can better assist in connecting the unemployed with their local workforce development programming beyond emails. Although DEED has done a great job given the circumstances, as things ease up and more people start planning to go back to work, now would be an opportune time for some creative solutions that would help workforce development organizations engage unemployed workers with resources in their own communities.
Special thanks
The Minnesota Department of Employment and Economic Development has been key in the development of this report. They provided the Center for Rural Policy and Development access to data that hasn’t yet been published, as well as provided valuable insights and interpretations of the data used in the research. We can not not thank them enough for their assistance.
[1] Similar to industries, the Bureau of Labor Statistics categorizes occupations into occupation groups. Industry groups describe what a business does. Occupation groups describe what the worker does. A worker could work in a business in the manufacturing sector, but their occupation could be welding or administrative.
[2] It’s important to note that this comparison in job vacancy rates uses two different data sources. The 2019 job vacancy rate is from DEED’s job vacancy survey, results from which are published twice a year. The 2020 September through November job vacancy rate uses the National Labor Exchange data which compiles all of the job postings in each region. We believe they are equivalent enough for comparison.
[3] Finding work or finding workers, part 1; Finding work or finding workers, part 2; Finding work or finding workers, part 3; Finding work or finding workers, part 4.
[4] Visit our supplemental page about number of occupations with shortages for further details. www.ruralmn.org/specific-occupations-facing-workforce-shortages
[5] Visit our supplemental page about workforce shortages and surpluses for further details. www.ruralmn.org/occupations-with-workforce-shortages-vs-surpluses
[6] Go to our supplemental page about projected workforce shortages and surpluses for further details. www.ruralmn.org/…
