
By: Kelly Asche, Research Associate
There isn’t a week that goes by here at the Center where we don’t use U.S. Census information in some form. Its importance in creating our research and helping to develop good policy cannot be understated. If you were to quickly breeze through our research for this year, you would see the wide range of ways we use Census data, such as:
- Using age, population, and factors in population change to highlight demographic changes across Greater Minnesota in our State of Rural report;
- Using homeowner age, age of homes, and home values to highlight challenges in developing new housing in Greater Minnesota;
- Using age data from multiple Census years to supplement and expand research conducted by the U of MN Extension’s Center for Community Vitality that shows the trend of 30- to 49-year-olds moving into rural areas of Minnesota in part 2 of our job vacancy research; or
- The use of Census data by nearly all of the authors in our Letters to the New Governor project to bolster their topics, from aging to public-private partnerships that supply broadband.
And it isn’t just the wide range of data that the Census provides, but also the geographic level at which data is available. As a team, we use a number of data sources to help us provide context to issues in Greater Minnesota. In fact, we used data from more than ten sources to create our Rural Atlas. However, only two sources provide economic and demographic data below the county level: the annual American Community Survey and the decennial Census.
|
Data source |
Origins |
Lowest-geographic level provided |
|---|---|---|
|
Decennial Census |
U.S. Census Bureau |
Census Tract |
|
American Community Survey |
U.S. Census Bureau |
Census Tract |
|
Population estimates |
U.S. Census Bureau |
City |
|
Population projections |
MN Demographic Center |
County |
|
Local Area Personal Income and Employment |
Bureau of Economic Analysis |
Micropolitan areas |
|
Local Area Unemployment Statistics |
Bureau of Labor Statistics |
Micropolitan areas |
|
Quarterly Census of Employment and Wages |
Bureau of Labor Statistics |
City/Township |
|
Non-employer statistics |
U.S. Census Bureau |
County |
|
Job Vacancy Survey |
MN DEED |
Economic Development Region |
|
Census of Agriculture |
USDA |
County |
|
Land Economics |
U of MN |
Townships |
Supporting continued and increased funding for the Census is, in a way, a form of support for rural Minnesota. Nearly all demographic and economic data outside of the U.S. Census Bureau only goes down to the county or micropolitan level. While some of these data sources may include larger rural cities such as Willmar, Alexandria, or Albert Lea, only the Census and the American Community Survey can provide demographic, housing and economic data for all of the cities and other subdivisions below county level. In the same way that the seven-county Twin Cities area can dominate and skew data for the entire state, at the county level, economic centers and larger communities can and do dominate the data for their individual counties, making it very hard to tease out what’s really going on in the smaller communities there. Remember, 85% of the communities in Minnesota have a population of 5,000 or less. And good policy is created primarily through the interpretation of accurate data specific to the area being looked at.
Not only is continued and increased support for the decennial Census needed, but even more importantly, increased support for the U.S. Census Bureau’s other major survey program, the American Community Survey, is needed due to its focus on economic data that isn’t gathered anymore by the decennial Census. This particular data is updated annually, giving vital, up-to-date data every year.
And that leads to another issue. Administering surveys is expensive, so to be efficient, the U.S. Census Bureau uses sampling to produce estimates of various economic, demographic and housing topics, meaning the survey is only sent to a certain number of households in each community. Inherent with sampling, however, are margins of error. Essentially, there is a 90% chance that the estimate provided and the actual value will differ by no more than the margin of error.
Why is this important? Well, due to the use of sampling, the margins of error attached to estimates in our smallest communities are so large that the data isn’t usable. Figure 1 provides the median household incomes for each community in Kandiyohi County. Each dot represents the estimate provided in the 2017 ACS 5-year while the lines represent the range in which the actual median household income may exist. For those of you not familiar with Kandiyohi County, Willmar is the economic center for the region with 7,473 households. The communities in the rest of the county are significantly smaller, ranging from 560 households (Spicer) to 23 households (Regal). The axis is arranged so that the community with the least number of households is first and then increases as you move right.
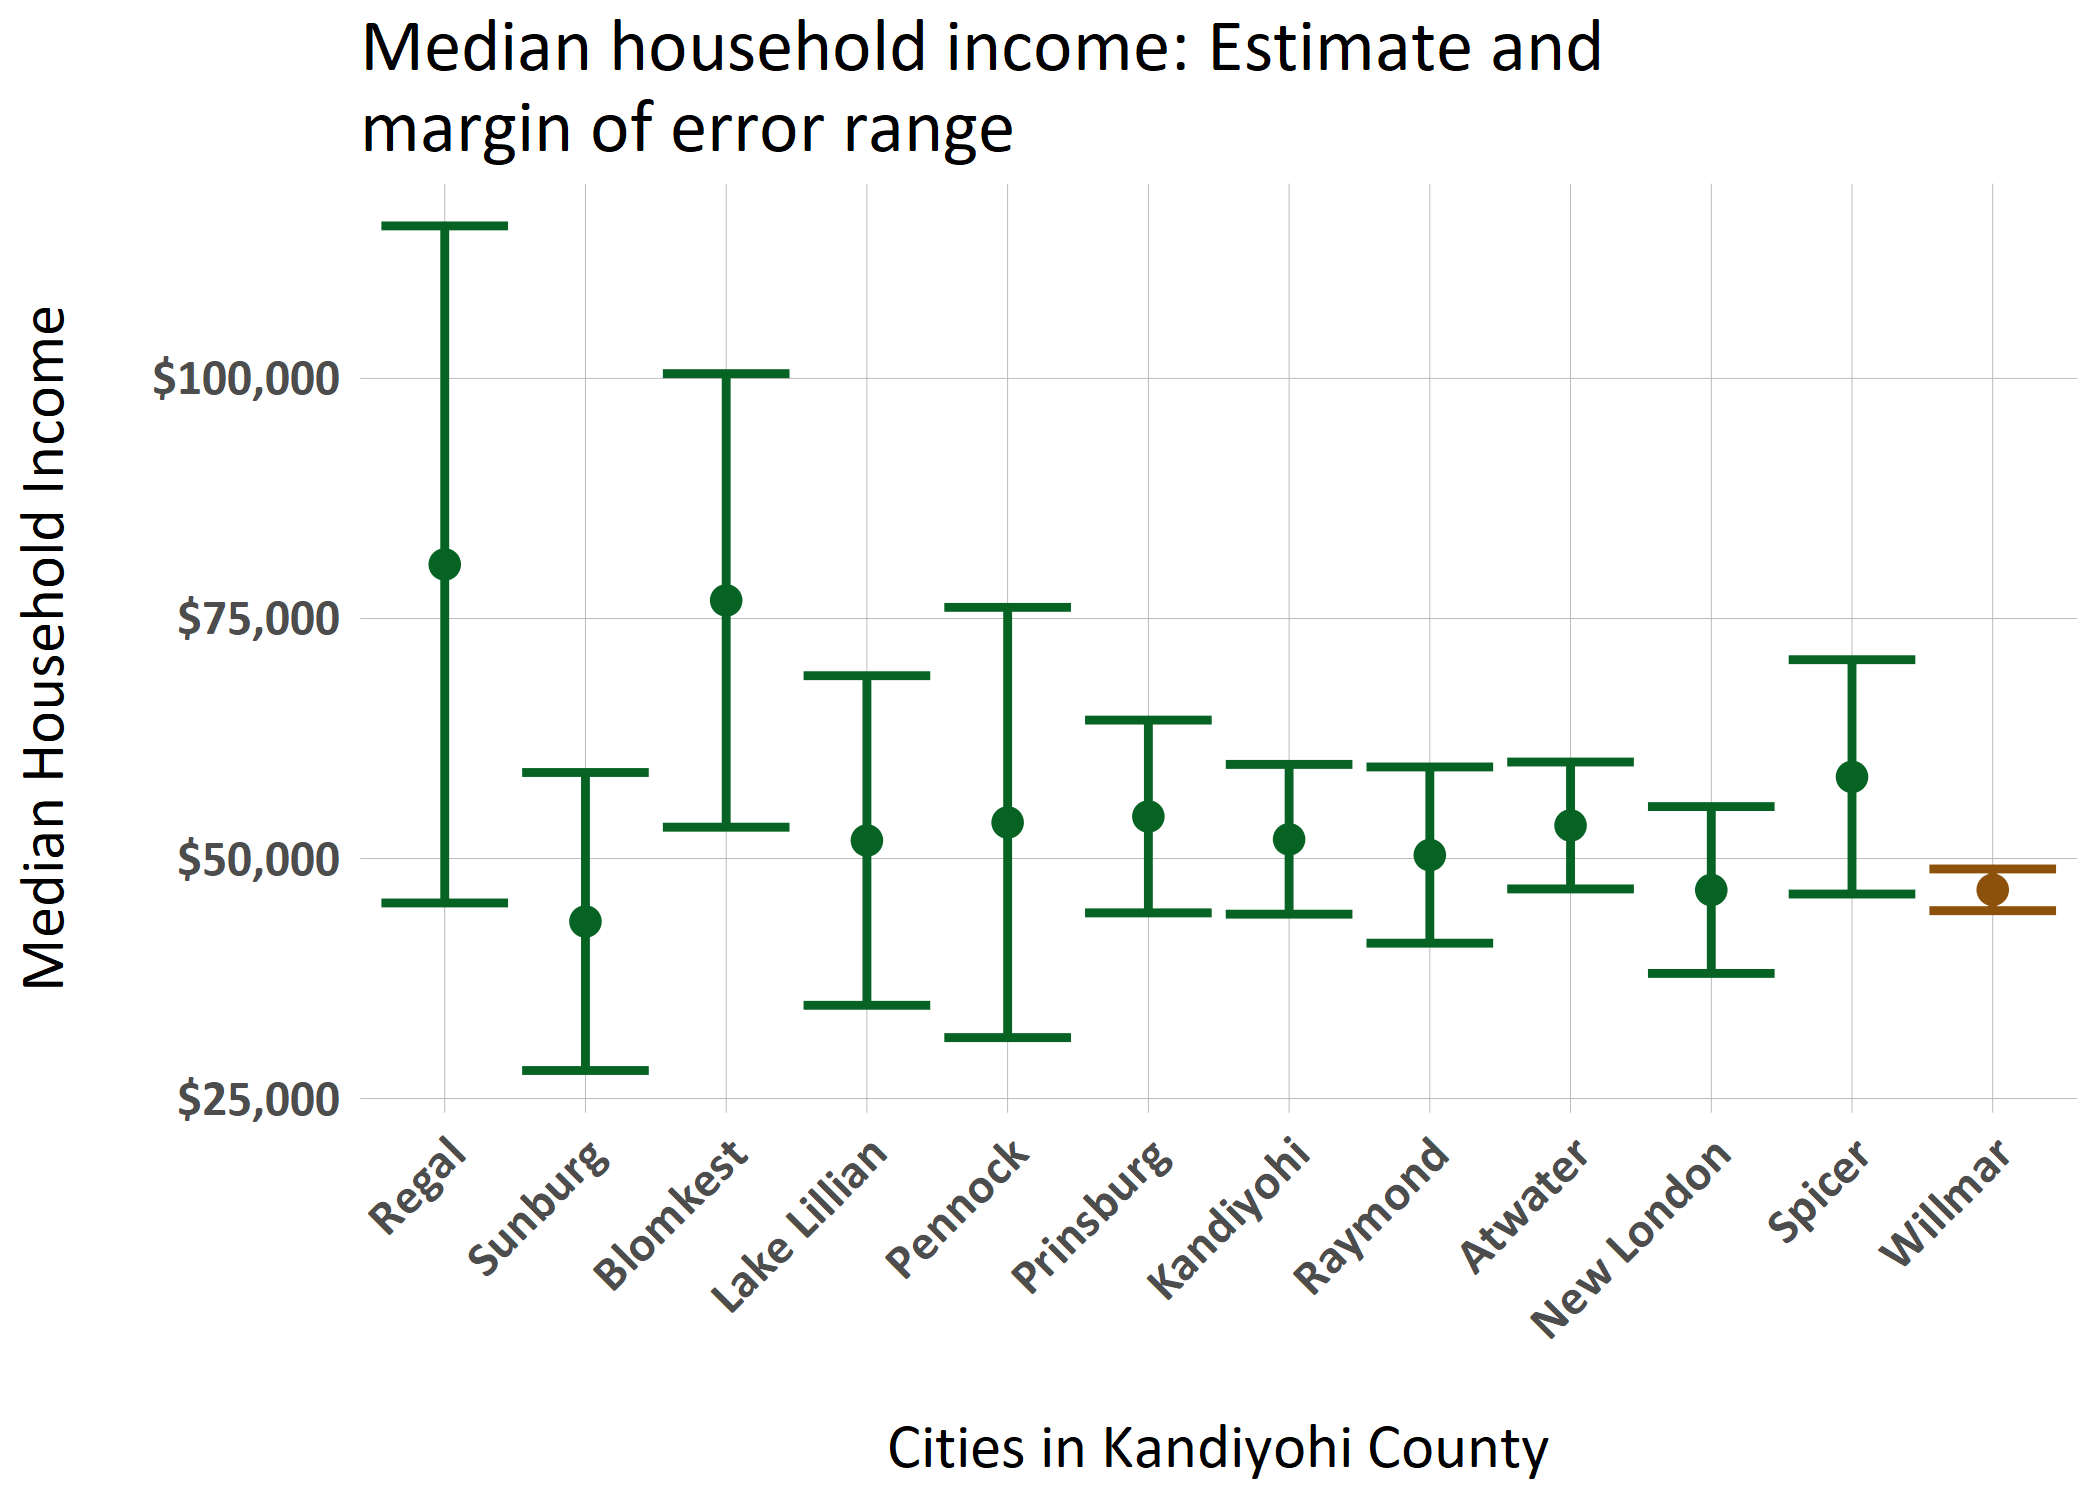
It’s pretty clear to see that the more households a community has, the smaller range of error. In fact, for Kandiyohi County, Willmar is the only community that had a margin of error that was less than 10% of the estimate (10% is a common threshold in statistics for usability). None of the communities have estimates that could be used with any sort of confidence (Table 2).
|
City |
Number of households |
MHI – estimate |
Margin of error |
Lowest MHI |
Highest MHI |
Margin of error as percent of estimate |
|
Atwater |
421 |
$53,438 |
$6,607 |
$46,831 |
$60,045 |
12.4% |
|
Blomkest |
57 |
$76,875 |
$23,616 |
$53,259 |
$100,491 |
30.7% |
|
Kandiyohi |
212 |
$52,000 |
$7,799 |
$44,201 |
$59,799 |
15.0% |
|
Lake Lillian |
127 |
$51,875 |
$17,161 |
$34,714 |
$69,036 |
33.1% |
|
New London |
524 |
$46,719 |
$8,689 |
$38,030 |
$55,408 |
18.6% |
|
Pennock |
170 |
$53,750 |
$22,401 |
$31,349 |
$76,151 |
41.7% |
|
Prinsburg |
207 |
$54,375 |
$10,036 |
$44,339 |
$64,411 |
18.5% |
|
Raymond |
290 |
$50,357 |
$9,176 |
$41,181 |
$59,533 |
18.2% |
|
Regal |
23 |
$80,625 |
$35,254 |
$45,371 |
$115,879 |
43.7% |
|
Spicer |
560 |
$58,500 |
$12,202 |
$46,298 |
$70,702 |
20.9% |
|
Sunburg |
45 |
$43,438 |
$15,517 |
$27,921 |
$58,955 |
35.7% |
|
Willmar |
7,473 |
$46,740 |
$2,172 |
$44,568 |
$48,912 |
4.6% |
What are the real-world implications of this issue? Well, many grants available to rural communities from philanthropic organizations and government agencies will typically base “need” on median household incomes. However, with margins of error so high for many rural communities, that can’t be looked at as an accurate representation of a community’s wealth status. This would likely lead to “undeserving” communities receiving aid while “deserving” communities are left in the cold.
This is not meant to criticize the American Community Survey, but rather to draw attention to the need for increased funding for this program so that rural areas can be represented by accurate data, leading to good policy.
So, when you see the decennial Census or the American Community Survey arrive in the mail, complete it! It’s important, and it is only used to benefit rural communities.