
By Kelly Asche
Every year the Center publishes the “State of Rural” report – a brief overview of the demographic and economic trends from a rural perspective. This year’s report will be published in December 2021. Over the next few months, we will be writing about some of the trends in the report here on our blog allowing us to dive a bit deeper than we can in the original report.
The Common Narrative
Everyone knows the common narrative – wages are lower in rural areas compared to metropolitan areas. An overlooked aspect of this narrative is the differences in the cost of living. Part of the narrative surrounding the gap in wages is the assumption that lower earnings will make it harder to make ends meet. The other half of that equation, the cost of living, is just as important to consider. And when we take that into consideration, the narrative becomes much more nuanced.
Let’s start with comparing the average hourly wage. Figure 1 provides the 2020 average hourly wage earned in each county. It’s easy to see that the highest hourly wages are concentrated in and around the seven-county metro. Those counties have average hourly wages of around $35 whereas it’s between $20 and $25 in rural Minnesota.
Figure 1: The highest average hourly wages are concentrated around the seven-county metro. Data: MN DEED – QCEW
It’s understandable that anyone seeing this chart would believe that living in the darker shaded counties would provide a better means to make a living. However, this is only true if the costs were same across Minnesota.
The Cost to Make a Living
Differences in wages across Minnesota are well documented. Less documented and well-known are the differences in the cost of living across Minnesota. Although it’s widely considered to be cheaper to live in rural Minnesota, until recently there has been little data to support this claim.
Fortunately, our Minnesota Department of Employment and Economic Development (DEED) compiles various data sources to calculate the cost of living in each county, including this extremely useful tool for employers and economic development officials in recruiting employees.
DEED uses a complex methodology utilizing various data sources to calculate the cost of living. It includes the costs of:
- childcare
- food
- health care
- housing
- transport
- income taxes
Figure 2 provides the hourly wage required to meet 100% of the cost of living in each county. The calculations are for a family of 3; 1 full-time worker, 1 part-time worker, and 1 child needing childcare. As the chart shows, the highest hourly wage required to meet the cost of living are concentrated in and around the seven-county metro. These counties require above $20 / hour to meet the cost of living. In rural Minnesota, the hourly wage required is between $14 and $16 / hour.
Figure 2: The hourly wage required to meet the cost of living is over $20 in and around the seven-county mero while it’s between $14 and $16 in rural Minnesota. Data: MN DEED – Cost of Living Calculator
Ability to make a living
The two previous maps essentially oppose each other; the wages are higher in our metropolitan counties, but so too is the cost of living. So, what happens when we bring those together?
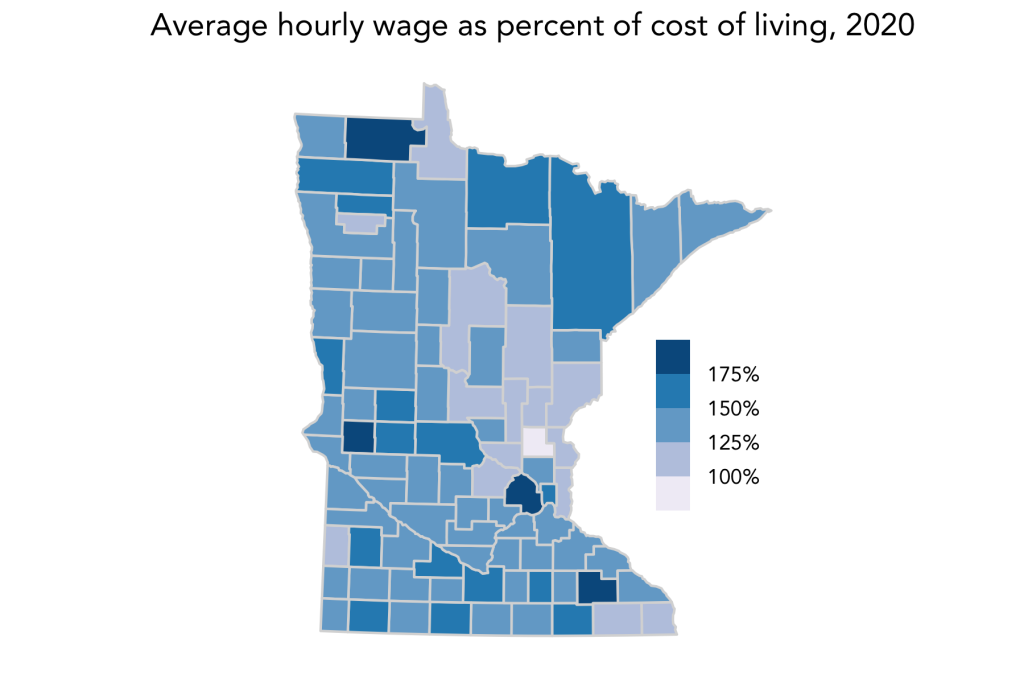
Figure 3 provides the average hourly wage of all industries as a percentage of the hourly wage needed to meet the cost of living for a family of 3 (one working full-time, one parent working part-time, and one child needing childcare). This map shows how the difference in wages are countered by the differences in the cost of living. Essentially, making a living can be attainable no matter what county you live in. The only real region where this isn’t the case are the counties to the north of the Seven-County metro where the rent and home payments are much closer to what they are in the core metro, but the wages are closer to rural averages.
Figure 3: When taking into account the cost of living, the differences in wages are “evened-out” by the difference in the cost of living. Data: MN DEED – Cost of Living Calculator | QCEW
This more nuanced picture provides a much more accurate representation of what a household might “feel” when living and working in various regions throughout Minnesota. It can also help our employers, economic development organizations, and resident recruitment leaders tell a more accurate story about what it’s like to live in their region. Wages alone don’t tell a complete picture.
This nuanced picture also helps us understand regions that are falling behind. The counties just north of the Twin Cities are likely feeling pinched. They are paying a high cost of living on wages meant for a low cost of living. Employers, organizations, and leaders in these counties may want to spend some time thinking about how this represents their region and what could be done.