
January 4, 2024
By Kelly Asche, Senior Researcher
Every December the U.S. Census Bureau releases the new American Community Survey data, representing the previous year. And with that release the Center for Rural Policy can update all the numbers representing rural Minnesota and release the annual “State of Rural” report.
The big takeaway again in this year’s report is the extraordinary shift in migration patterns that started in 2020 and continues into 2022: migration into Greater Minnesota and migration out of the urban areas.
In the public mind and the popular press, a lot of weight is put on whether a region’s population is growing or shrinking. For much of rural Minnesota, outside of recreational areas, population declines have been the story. Population change is dependent on two factors:
- Natural change: deaths versus births, and
- Migration change: out-migration versus in-migration.
Over the last few decades, the pattern has been that more rural areas of the state experienced more deaths than births, leading to a negative natural change. This is what occurs in most of rural Minnesota. However, migration change is more nuanced than natural change and is more dependent on the region. Agricultural-linked rural areas have tended to experience out-migration on top of negative natural change, leading to more population loss. Recreational/lake areas of rural Minnesota have tended to experience enough in-migration to offset the negative natural change, leading to population gains.
What’s interesting about the current numbers, though, is that natural change has been getting worse: net gains (more births than deaths) have lessened while net losses (more deaths than births) have become more severe. On the other hand, the migration change patterns have shifted significantly, leading to more rural counties overcoming the negative natural change.
State Demographer’s RUCA Codes
Below you will see charts with MN counties grouped into four categories – entirely rural, town/rural mix, urban/town/rural mix, and entirely rural. The Minnesota State Demographer created these categories and you can read more about them here. The Center for Rural Policy and Development also has a quick write up about how these categories are developed, which you can read here. The most important aspect to know about these categories is that they take population and work commuting patterns into account. Figure 1 shows the categories for each county in the state.
Figure 1: MN State Demographers Office analyzed each county to determine their rural-urban commuting area category. Data: MN State Demographer
Natural Change
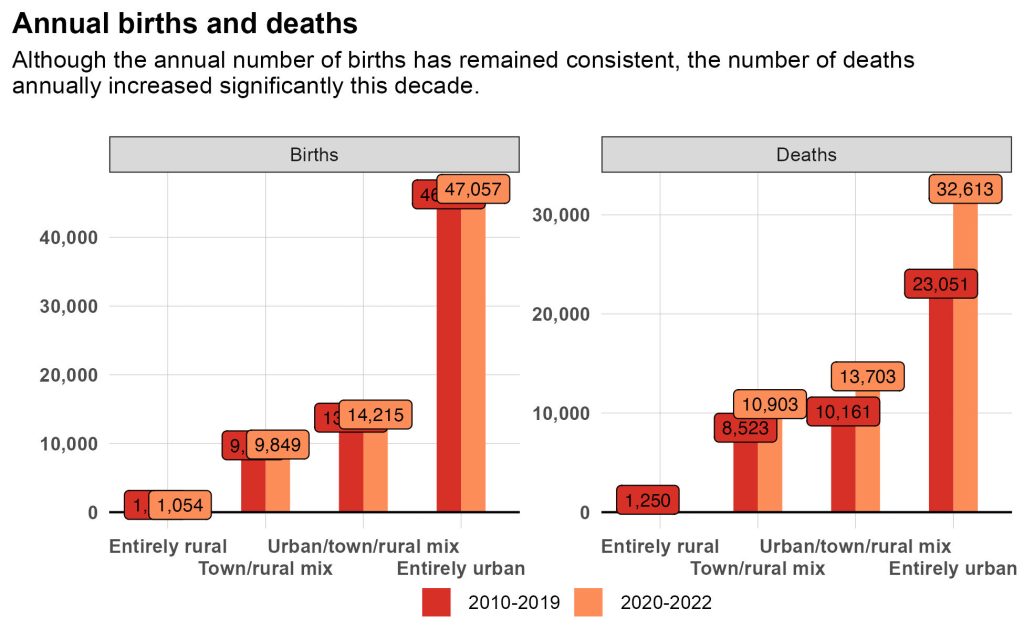
To get the net natural change we take the number of births minus the number of deaths. Typically, trends within these two aspects of natural change are slow to change, but the pandemic was a significant disruptor and increased the number of deaths significantly. Figure 2 shows that the number of annual deaths for each region has increased significantly. This is likely due to the pandemic and the increase in deaths that occurred in 2020 and 2021.
Figure 2: The number of births has remained consistent, but the number of deaths during the pandemic increased significantly. Data: US Census Bureau – Annual Population Estimates
Due to the increase in deaths and the comparatively constant rate of births, the overall natural change has worsened. Figure 3 shows the drastic difference in population change due to birth and death rates when comparing the two decades.
Figure 3: Natural change is a measure that compares the number of births to deaths in an area, leading to a net population gain or loss. In our current decade, the annual natural change has worsened across Minnesota compared to last decade. Data: U.S. Census Bureau, Annual Population Estimates
Migration change
Although these shifts in the annual natural change are dramatic, the migration change numbers are even more so. Figure 4 shows annual net migration change during the last decade compared to the current decade. The shift is easy to see – the entirely rural county group was experiencing a net migration loss of 276 people per year last decade, but from 2020 to 2022, they experienced a net migration gain of 344 people per year. Town/rural mix counties went from a net migration loss of nearly a 1,000 per year and now are experiencing an annual net migration gain of 3,022 people per year. Urban/town/rural mix counties increased from 205 people to nearly 6,000 people per year. And entirely urban went from a 11,000 net gain per year to an 18,000 loss per year.
Figure 4: In-migration and out-migration has flipped so far this decade. Data: US Census Bureau – Annual Population Estimates
So now that we’ve seen the two components of population change (natural and migration), we can add all of this up to see what the overall net gain or loss is per year in population. All four county groups are experiencing population gains or losses this decade that are very different compared to last decade.
So far this decade, though, the annual population change has shifted dramatically compared to last decade. Figure 5 shows how entirely rural counties used to average a loss of 466 people per year, but with the shift in migration patterns, the average has shrunk to a loss of only 95 people per year. In the completely opposite direction, entirely urban counties, which average a net gain of 33,805 people per year have now averaged a loss of 3,251 people per year.
Figure 5: When adding up natural change and migration change we get the total annual population change occuring in the four county groups. The annual change this decade is very different from the annual change of last decade. Data: US Census Bureau – Annual Population Estimates
This shift has translated into more rural counties that have a higher population in 2022 than they did in 2010. In fact, there are now 10 more counties that had a lower population throughout the 2010s that now have a higher population (Figure 6).
Figure 6: Due to in-migration, there are 10 more counties that have a higher population in 2022 than they did in 2010, a complete about-face from the previous decade. Data: US Census Bureau – Annual Population Estimates
The primary causes of this shift in migration are still being debated, but two likely culprits are the skyrocketing housing costs in urban areas, the ability to work from home now that broadband is widely available, and the growing number of job opportunities in rural areas. It’s only been a few years and so these shifts are not yet trends. We will have to wait until next year to see if they continue.