

Understanding Where Graduates Go After High School
Every year, students graduate from high schools across Greater Minnesota, beginning the transition to adulthood. Some continue on to college, others enter the workforce directly, and many move between education and work in the years that follow. Over time, these early transitions shape not only the individuals’ careers but also the region’s labor force, economic stability, and long-term population trends.
To better understand this important point in young people’s lives, we undertook the project of examining what happens to Minnesota’s high school graduates after they leave the K–12 system. Rather than focusing on a single point in time, however, we used data to follow graduates for more than a decade after high school. We did this to see if we could identify large patterns in how postsecondary education, workforce participation, and geographic mobility unfold over time and to see if we could discern decisions that put people on particular pathways. The goal was not to explain individual decisions or assign cause, but to gain insight into how education systems and workforce systems intersect in practice.
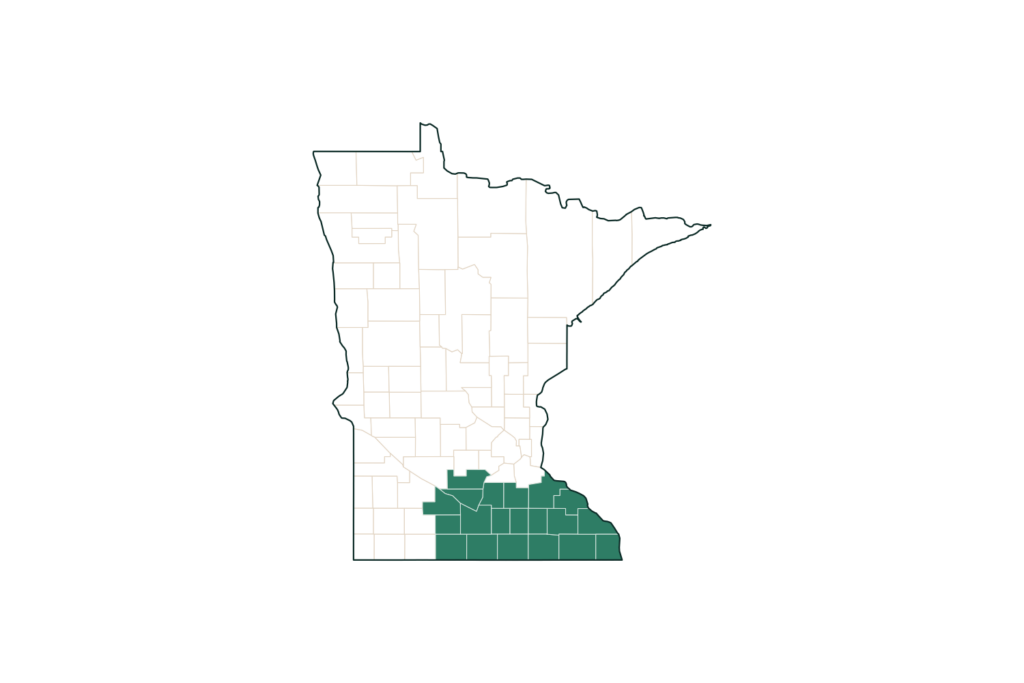
This report looks at high school graduates from Southeast Minnesota who graduated between 2008 and 2023. During our analysis, three broad patterns, or “pathways,” emerged from the data.
- The Postsecondary Credential Earner Pathway: Just over half of high school graduates (52%) completed some kind of postsecondary credential. Among these “credential earners,” a majority of them went on to stable, consistent workforce participation. Where they earned that credential strongly influenced whether they stayed in or returned to their home region or went elsewhere for work.
- The Workforce-First Pathway: Others entered the workforce directly without earning a credential. Among these students, Career and Technical Education programs in high school were the clearest differentiator between those who found consistent, stable employment within the region and those who didn’t.
- The Disconnected Pathway: A third group experienced persistent disconnection from both postsecondary education and sustained employment, a condition that, for many, does not resolve on its own and is shaped by structural barriers that begin well before high school graduation. In the Southeast region, the Disconnected numbers are also driven somewhat by the influence of opportunities in border states.
These same patterns emerged in the other regions of Greater Minnesota and were surprisingly consistent, with only some small variation by region.
Understanding that these distinct pathways exist — and what they mean — matters for regional planning and workforce development. Treating where students go after high school as if each were on a random, unique path that started the day after graduation hides the fact that there are a few large-scale patterns that connect high school to the workforce. Looking instead at the pathways students actually grouped into gives a clearer picture of how they ended up where they did.
About the Data
This analysis draws on linked administrative data provided by the state. Using anonymized records, we were able to connect data across systems, creating a longitudinal view of educational pathways and employment outcomes after high school that wasn’t visible before. Three primary data sources were used:
High School Records. Courses taken; participation in CTE; Minnesota Comprehensive Assessment and ACT test scores; and indicators for special populations such as students of color, students in special education, or those qualifying for free or reduced-price lunch. Together, these records described students’ academic preparation and learning experiences prior to graduation.
Postsecondary Records. Enrollment, persistence, and completion data drawn from Minnesota’s public higher education systems and the National Student Clearinghouse. These records capture both in-state and out-of-state attendance and identify the types and locations of institutions students attended.
Employment Records. Wage and employment records from the Minnesota Department of Employment and Economic Development (DEED) captured employment within Minnesota, including hours worked, employer attachment, and indicators of job stability. Employment outside Minnesota was not directly observed.
Note: The findings in this report should be interpreted as associations only and not causes. The analysis highlights where outcomes tended to cluster, offering context for regional planning, but we are not able to say definitively that the presence of a certain characteristic caused an outcome, only the degree to which it made that outcome more likely. Read the “Limitations” section in the Appendix for a more thorough discussion on how we use “predictability” and “likelihood” in this report.
The entire dataset was split into individuals that graduated from five distinct regions. This report is focused on the Southeast counties, including Economic Development Regions 9 (South Central) and 10 (Southeast). This analysis examined 122,938 individuals who graduated from school districts within this region from 2008 to 2023.
Tracking Outcomes Over Time
Each graduate’s workforce and/or education status was assessed every year after high school. Rather than looking at a single point in time, we tracked patterns across multiple years after high school graduation, with particular attention to outcomes at Year 1 (short-term transition), Year 5 (mid-term attachment to an employer or career), and Year 10 (longer-term employment patterns). This reduced the influence of short-term fluctuations and highlighted relationships that held up over time.
Each year, individuals were assigned to one of five mutually exclusive categories, based on their situation at the time:
Sustained Workforce Participation—Southeast (Regional Employment). Worked 1,000 hours or more that year with a single employer in the Southeast Minnesota region — stable, in-region employment. This is the employment situation most directly tied to the region’s own economy: it represents a graduate’s labor and skills directly benefiting Southeast Minnesota.
Sustained Workforce Participation—MN. Worked 1,000 or more hours that year with a single employer elsewhere in Minnesota — stable employment, but outside the region. This category reflects a “leakage” of workforce investment: the graduate is stably employed, but the region isn’t the one benefiting. It’s central to understanding regional retention.
Non-sustained Workforce Participation. Had a record of Minnesota employment but fell short of the sustained threshold of 1,000 hours and wasn’t enrolled in postsecondary education. They typically worked part-time or intermittently. While it may have been by choice, this can signal underemployment or economic instability, which matters for workforce development planning.
Attending Postsecondary. Enrolled in postsecondary education without meeting the sustained employment threshold — often full-time students or those newly transitioning out of high school. This category represents continued investment in education rather than disengagement since many move into the workforce categories in later years.
No Minnesota Employment Record, Not Attending Postsecondary. No observed MN employment or enrollment record for the year. Includes people working in other states, in the military or other federal employment, a stay-at-home parent, or someone otherwise outside the labor force. This category mixes very different situations — an out-of-state career move looks the same in the data as true disconnection from work and school — so it needs to be interpreted carefully rather than treated as a single “disconnected” outcome.
The Findings: Paths Taken by High School Graduates
Finding 1: Where students went after high school
Figure 2 charts how many Southeast Minnesota students ended up in each of the five categories each year after high school. The pattern created by students’ outcomes was surprisingly consistent across all five regions, only varying by a few percentage points from one region to the next. For many students, the first step was further education. In the first year after graduation, over half of Southeast Minnesota’s graduates enrolled in a postsecondary institution, whether a local community college, a technical program, or a four-year university. Another 17% were in the non-sustained workforce category, not surprising for recent high school graduates; 14% had sustained employment in the region, while 5% had sustained employment somewhere else in Minnesota, and 10% had no Minnesota employment record.Finding 2: Three Distinct Pathways
The next step in our analysis was to better understand how students ended up in their respective categories. Within the data, a surprisingly consistent pattern of three broad “pathways” emerged. The pathways students ended up on depended on their plans, choices and structural opportunities and barriers in high school and even earlier. These factors correlated highly with these pathways, meaning that given a particular set of factors, the outcome, while not set in stone, was still highly predictable.
The three pathways are:
The Postsecondary-Credential Earner Pathway. High school graduates who went on to complete a postsecondary credential — a degree, certificate, or similar. Completing that credential was the strongest single predictor of later workforce outcomes: these “credential earners” were substantially more likely to be in sustained employment five years after high school than those who didn’t complete some kind of postsecondary credential program. Where they finished their program also mattered a great deal geographically — people tended to stay and work where they earned their credential.
The Workforce-First Pathway. Graduates who did not complete a postsecondary program but instead entered the workforce directly. Among this group, the strongest predictor of eventual sustained employment in the region was participation in career-aligned prep courses in high school such as CTE.
The Disconnected Pathway. A majority of persons who did not complete some kind of postsecondary education program and were not involved in CTE experienced persistent disconnection from the labor force in the years following high school. For many, this was not a temporary condition—it was a long-term trajectory shaped by structural barriers that began well before high school graduation. The data provided clear clues as to who is most at risk and what offered protection against this disconnection while also acknowledging the role border states play in these outcome categories.
Each of these three pathways works differently, and lumping them together would hide exactly the patterns this report is trying to surface. A graduate who’s steadily employed nearby, one who’s cycling through unstable jobs, and one who’s disappeared from Minnesota’s employment records entirely are having three very different experiences, and each requires a different kind of response from workforce developers. The sections below take each pathway on its own terms: what it looks like, who tends to end up there, and what seems to make a difference.
The goal of this report
The goal of this report is not to decree that one pathway or outcome is better than another, but simply to introduce these findings and describe them, in this way helping workforce development professionals, education professionals, local and state officials and others interested in Greater Minnesota’s economic health understand the high-school-to-workforce pipeline and make informed decisions to improve it.
Pathway 1: The Credential Earners’ Pathway
The first major discovery in the dataset was this: Completing some kind of postsecondary education program had the most impact on whether a student ended up in sustained workforce participation for years to come.
Students who completed a program and received a credential, whether a four-year degree, two-year degree, certificate or other credential, followed a fundamentally different path compared to those who didn’t complete some kind of postsecondary education, and in particular, those who never started a postsecondary program at all.
This section walks through this finding in three parts:
- How strongly earning a credential is tied to steady employment;
- Which characteristics were associated with a graduate completing a credential in the first place; and
- What factors shaped whether credential earners built their career in the region or somewhere else.
Completing postsecondary education (or not completing it) had the strongest association with workforce participation outcomes across all the variables measured.
How strongly earning a credential is tied to steady employment
Just over half of Southeast Minnesota’s high school students graduating between 2008 and 2019 had completed some kind of postsecondary credential in the first five years after high school while the other half did not. Of those who completed a postsecondary program, 61.2% were in sustained workforce participation somewhere in Minnesota by Year 5, either inside or outside the Southeast region. By comparison, of those individuals who did not complete a postsecondary program, only 46.6% were working at the sustained workforce level in the region or elsewhere in Minnesota (Figure 5). The 14.6-percentage-point difference shows a strong correlation between completing some kind of postsecondary education or training and finding sustained full-time work.
Notably, the largest share of credential earners — 35.0% — ended up in sustained workforce participation in their home region, making a postsecondary credential directly relevant to Southeast Minnesota’s workforce.
What factors were more highly associated with completing a postsecondary program?
Gender. Female graduates completed postsecondary credentials at notably higher rates than male graduates, even after accounting for other differences between them.PSEO participation. Taking college courses while still in high school through Postsecondary Enrollment Options (PSEO) made a real difference — a fairly intuitive result, since PSEO participation means a student is already earning college credit before they graduate from high school.
Advanced Placement exam. Students who took at least one AP exam completed postsecondary credentials at a meaningfully higher rate than those who didn’t, regardless of the score they earned. Of all the characteristics examined, AP exam participation was associated with the largest difference in the likelihood of completion.
SAT exam. Graduates who took the SAT also completed postsecondary credentials at a higher rate than otherwise similar graduates who didn’t, though the difference was smaller than for AP or PSEO participation. Because the ACT has historically been the dominant college entrance exam in Minnesota, taking the SAT may reflect a more deliberate step toward college on the student’s part, such as applying to institutions that require or prefer it.
English learner status. Graduates who were identified as English learners in high school completed postsecondary credentials at a modestly higher rate than otherwise similar graduates who were not, even after accounting for race and ethnicity. Because the association holds up independent of race, something distinct from race and ethnicity appears to be driving it.
Local labor market. Where a graduate went to high school also mattered, independent of anything about the graduate themselves. Both higher local unemployment and stronger local wages were associated with a higher likelihood of completion — two different signals from the same underlying economic geography, both pointing the same direction. In the Southeast region, the local unemployment rate was the stronger of the two associations.
This association may seem a bit confusing, but higher local unemployment and higher local wages appear, in fact, to capture two distinct pressures pushing in the same direction: in areas with fewer immediate job opportunities (higher unemployment), a postsecondary credential may feel like a more necessary path forward, while in higher-wage areas, families may have more resources to support a graduate through college. The data can’t confirm which mechanism is doing the work in any individual case, but both hold up as real, independent associations.
CTE concentration. Graduates who completed a full Career and Technical Education sequence in high school were slightly more likely to complete a postsecondary credential than those with no CTE background. The difference was the smallest of any characteristic examined, but it held up independently. It’s worth noting because CTE is often thought of as a path away from postsecondary education; here, it was associated with a small advantage toward completion.
Taking the ACT. Academic preparation, measured as ACT test performance, was one of the strongest characteristics associated with completing postsecondary education. Unlike the other factors on this list, though, it isn’t a simple yes/no comparison. While simply taking the test is associated with a real advantage, there is also an added layer in that the score matters more the higher it goes. Rather than a fixed boost, the likelihood of completing a postsecondary credential rose steadily as ACT scores increased.
Simply taking the ACT is associated with a substantial jump in the likelihood of postsecondary completion (Figure 6). Among those who didn’t take the ACT, only 33% completed a postsecondary program, compared to 66% of those who did take the test. But if we break out college completion by ACT score, an interesting thing happens. As the score rises, the likelihood of postsecondary completion climbs steadily also, from 42% at the low end of the scores to 59% at a score of 21 (the national median) and 82% at 36. The highest scorers completed a postsecondary program at more than double the rate of graduates who never took the test at all.
Where Do Credential Earners Establish Their Careers?
Among those who earned a credential, the data revealed another powerful pattern with implications for Southeast Minnesota’s ability to retain the talent it produces: Where a graduate completed college was strongly associated with where they ended up working. This wasn’t a complete surprise. Research has demonstrated for years that people tend to stay where they earned their postsecondary credential. This knowledge is important for workforce developers and employers who are looking to bolster their region’s labor force ranks. Figure 8 illustrates the strong alignment between where a credential earner earned their degree and where they ended up working. Among those who graduated from a college in the Southeast region, 53% went on to have sustained workforce participation in the same region. Among those who graduated from a college elsewhere in Minnesota, 43% ended up with sustained workforce participation in the state but outside the region. And among those who graduated from a college outside Minnesota entirely, only 21% returned to the region, while 46% had no Minnesota employment record, indicating that they were most likely working in another state.What factors shaped whether students completed their postsecondary programs in the region or somewhere else?
Many of the same factors that indicated a student would complete their postsecondary program also indicated where they would complete their program. Using the same approach as before — examining each characteristic’s relationship to college location while accounting for every other characteristic at the same time — several factors emerged as independently associated with whether a credential earner graduated from a regional institution or somewhere outside the region (Table 1).| More Likely to Complete a Postsecondary Program within the Region | More Likely to Complete a Postsecondary Program Outside the Region |
|---|---|
| Taking the ACT. Simply taking the ACT — regardless of score — was associated with a large, independent pull toward completing a credential regionally, the strongest association of any characteristic examined. | American Indian race/ethnicity. American Indian graduates were less likely to complete their credential within the region than White graduates — the largest gap on this side of the table. |
| Entirely urban community. Graduates from school districts in entirely urban counties were more likely to complete their credential regionally than those from town/rural mix districts. | Higher local wages. Graduates from areas with stronger local wages were less likely to complete their credential regionally. |
| Economic disadvantage. Graduates who qualified for free or reduced-price lunch were more likely to complete their credential regionally. | SAT exam participation. Students who took the SAT were less likely to complete their credential regionally, consistent with a group oriented toward postsecondary options outside the region. |
| Hispanic identity. Hispanic graduates were more likely to complete their credential regionally than non-Hispanic graduates. | AP exam participation. Students who took an AP exam were less likely to complete their credential regionally, identifying another group of students oriented toward postsecondary options outside the region. |
| Urban/town/rural mix community. Graduates from urban/town/rural mix districts were also more likely to complete regionally than those from town/rural mix districts, though the effect was smaller than for entirely urban districts. | |
| CTE participation. Students with lighter CTE participation were more likely to complete their credential regionally than those with no CTE background. | |
| CTE concentration. Students who completed a CTE concentration or program — deeper, sustained CTE engagement — were also more likely to graduate from a regional institution, by about the same margin as lighter participants. |
What does this mean for Southeast Minnesota?
The Credential Earners Pathway shows a clear pattern for Southeast Minnesota. Just over half of high school graduates completed a postsecondary credential, and those who did were significantly more likely to have ongoing sustained workforce participation. Among credential earners, where the degree was earned had far more of an impact on where that person eventually settled down for their career than what degree was earned, though credential type still added a smaller, independent pull of its own — sub-baccalaureate completers were somewhat more likely than bachelor’s completers to end up working in the region, but that gap was modest next to the much larger gap between graduating regionally and graduating anywhere else.
Academic preparation’s relationship to staying local isn’t as simple as “the most prepared students leave.” Engaging with the ACT at all leaned regional; it was specifically strong scores — along with AP and SAT participation — that predicted leaving. CTE engagement at any level, economic disadvantage, Hispanic identity, and communities in entirely urban or urban/town/rural mix districts all pointed toward staying regional. American Indian graduates showed the strongest pull toward completing outside the region, and graduates from higher-wage areas were also more likely to complete elsewhere.
Pathway 2: The Workforce-First Pathway
The Workforce-First Pathway is the story of those Southeast Minnesota high school graduates who did not complete a postsecondary credential but still went on to find sustained workforce participation, mostly in the Southeast region but also in the rest of the state. These are the high school graduates who entered the workforce directly without completing a postsecondary program.What factors were more likely to keep non-credential earners connected to sustained regional workforce participation?
Among non-credential earners, two characteristics stood out as independently associated with sustained workforce participation in the Southeast region: engagement with CTE and engagement with the ACT.CTE Engagement
Students who completed a full CTE sequence — becoming what’s known as a “concentrator” — were significantly more likely to have sustained workforce participation in the region than peers with no CTE involvement. Figure 15 shows how much CTE engagement was a factor for non-credential earners five years after high school. Those who finished a full sequence of CTE courses had a predicted 37% likelihood of sustained regional employment compared to 25% for otherwise similar peers with no CTE involvement. Even lighter CTE participation, short of a full sequence, showed a smaller but still real effect: 31% versus that same 25% baseline. Both of these differences showed up at one year after high school and continued to grow through year 10, making CTE one of the most durable characteristics identified in this analysis. While several other factors we examined eventually shifted, faded, or reversed, CTE’s relationship with non-credential earners and regional attachment only deepened over time.ACT Scores
As it did in the credential earner pathway, taking the ACT test comes with a twist. Simply taking the ACT — regardless of score — was associated with meaningfully higher odds of sustained regional employment. Among non-credential earners who did not take the ACT but who are otherwise similar in gender, race and ethnicity, economic background, and every other characteristic included in this model, the predicted likelihood of sustained regional employment at five years after high school graduation is 33%. But as with the Credential Earner Pathway, the relationship between ACT engagement and future sustained workforce participation in the region among non-credential earners also depended on the score achieved. As in the Credential Earners’ Pathway, taking the ACT and scoring modestly indicates a real likelihood of regional attachment, while scoring higher on it indicates a real likelihood of not having regional attachment. The likelihood starts out higher for non-credential earners who took the test and received lower scores, at 39% for a score of 12, but the odds fall from there. For non-credential earners who scored 36, the likelihood of them having sustained workforce participation in the region at five years after graduation was only 17%.What works for the Workforce-First pathway?
Taken together, CTE engagement is the clearest and most reliable factor identified for this pathway, and the relationship with sustained workforce participation in the region only strengthens over time. ACT participation matters, too, though it behaves differently than CTE: simply taking the ACT raises the likelihood of sustained workforce participation in the region, but when the score achieved is considered, higher scores indicate a person is more likely to leave the region, while a lower score is a real, substantial indicator of someone who will stay in the region, just as with credential earners.While several other factors we examined eventually shifted, faded, or reversed, CTE’s relationship with non-credential earners and regional attachment only deepened over time.
Pathway 3: The Disconnected Pathway
Apart from those non-credential earners who ended up on the Workforce-First Pathway because of their sustained workforce participation, there is another sizeable group of non-credential earners who do not. These are the individuals who find themselves on the Disconnected Pathway. The analysis revealed why this group tends to be disconnected from the workforce, what disconnection actually looks like, and why it often persists rather than resolving on its own.
Five years after high school, 47% of non-credential earners were on the Workforce-First Pathway, with sustained workforce participation in either the Southeast region or elsewhere in Minnesota (Figure 17). The other half of non-credential earners (53%) were either individuals with no Minnesota employment record (28%) or in non-sustained workforce participation (25%), meaning that in a given year they were working less than 1,000 hours and/or for more than one employer. This group is on the third pathway that emerged: the Disconnected Pathway.
Disconnected Pathway
High school graduates → Non-credential earners → Non-sustained workforce participation or no Minnesota employment record
Those individuals on this pathway were either not engaging fully with the local or state workforce (non-sustained workforce participation) or out of the local or state workforce completely (no Minnesota employment record). Moreover, for many in this group, that disconnection did not resolve on its own. This group was persistently disconnected from the labor force across the years. A handful did reconnect and move into the sustained workforce participation group, but for most, weak workforce attachment was not a temporary early-career condition—it was a trajectory.
This group is important because they represent a substantial pool of individuals who, for a variety of reasons, are not engaging fully with the local workforce (or even the state workforce) but could be if given the right mix of interventions before and after high school graduation. Perhaps one of the most important findings about this group was that the factors characterizing them made them almost easy to identify while still in K-12 and therefore ready for help if they wanted it.
It is worth a brief reminder of what “no Minnesota employment record” means in this context since it can reflect very different circumstances depending on the population being examined. As discussed earlier, for credential earners—particularly those who graduated from institutions outside the region or outside the state—the data showed that no Minnesota employment record often reflected out-of-state graduation, followed by out-of-state employment. For Southeast Minnesota specifically, “out of state” doesn’t necessarily mean far away: the region borders Wisconsin along the Mississippi River and Iowa to the south. Minnesota’s tuition reciprocity agreement with Wisconsin makes institutions just across the river, such as the University of Wisconsin–La Crosse and Western Technical College, an easy and affordable option, and graduates may go on to work in the La Crosse area or elsewhere in western Wisconsin. Along the southern edge of the region, northern Iowa employers and institutions are similarly close at hand. Minnesota’s employment records simply can’t see across either line, so a completer working in La Crosse, a few minutes from home in La Crescent, looks identical in this data to one who moved across the country.
That same border dynamic matters less when interpreting “no Minnesota employment record” among non-credential earners. Regional labor market data provide a useful benchmark: among Southeast Minnesota adults whose highest level of education is a high school diploma, 21.8% are not in the labor force — a rate that would be expected for this group even before considering the added barriers facing individuals in the Disconnected Pathway specifically. The observed rate is 28.1% — about 6 percentage points higher, a gap modest enough that the added barriers facing this group could plausibly account for much of it on their own. That stands in contrast to some other regions, where the observed rate far outpaced what national patterns would predict. Some share of the Southeast gap may still reflect non-credential earners working just across the Wisconsin or Iowa border, or working for themselves: Minnesota’s employment records are based on employer-reported wages, so an individual working as a self-employed contractor or running their own small business would not appear in this data, regardless of location. That’s not a trivial group in Southeast Minnesota, where nonemployer businesses (those with no paid employees) amount to roughly 14 for every 100 payroll jobs in the region. Military service and federal employment, which are also absent from state wage records, are too small in the region (under 1% combined) to account for much of the difference. On balance, though, the data suggest that for Southeast Minnesota non-credential earners, “no Minnesota employment record” largely reflects genuine disconnection from the workforce rather than employment the data simply can’t see.1
Persistence of disconnection
To determine how disconnected from the workforce each person in the group was, we tracked their workforce participation status across the first five years after leaving formal education. For individuals who never attended postsecondary education, this meant the five years immediately following high school graduation. For those who attended college but did not complete a credential, this meant the five years after they stopped attending. Individuals were then grouped by the degree of disconnection:- Consistently Attached to the workforce: Disconnected in 0 of the first 5 years. In other words, they had consistently sustained workforce participation for five of the first five years.
- Intermittently Disconnected: Disconnected in 1-2 of the first 5 years
- Broadly Disconnected: Disconnected in 3 of the first 5 years
- Persistently Disconnected: Disconnected in 4-5 of the first 5 years
Two Kinds of Disconnection
Within the Disconnected Pathway, non-sustained workforce participation means someone is working, just not steadily enough to meet the threshold of a sustained workforce participant. Think part-time, seasonal, or frequently interrupted work. No Minnesota employment record means there is no evidence the person worked in the state at all that year; it could mean they moved out of state for work, they left the workforce to be a stay-at-home parent, got a federal job, joined the military or started their own business. The data alone can’t always tell the difference. These two situations don’t just look different—they behave differently by moving in opposite directions over time. Non-sustained employment is the more common experience early on, but the group shrinks year after year as people either find sustained workforce participation or shift into the no-Minnesota-employment-record group. Having no Minnesota employment record behaves the opposite way. Fewer people experience it in year 1, but for those who do, it tends to stick. Instead of shrinking over time like non-sustained workforce participation does, it grows year over year.Who is Most at Risk of Disconnection?
Within the analysis, the data revealed a set of demographic, academic, and geographic characteristics associated with a higher likelihood of ending up on the Disconnected Pathway. Understanding who faces these risks is the first step toward knowing where support is needed most.
Besides being in either the non-sustained workforce participation category or the no Minnesota employment record category, individuals in the dataset also carried with them their own unique mix of social, economic and demographic characteristics. We tested each of these characteristics to see if any of them, on their own, might influence which pathway a person might end up on. To take the analysis one step further, we asked: For each characteristic examined, is the elevated risk showing up as unstable employment, as no Minnesota employment records, as both or as neither?
Several characteristics in fact showed elevated risk on one side but not the other — an individual’s demographic profile can point toward a real risk of unstable employment while showing no relationship at all to disappearing from the record, or vice versa. Only Black identity showed an independently confirmed, elevated risk on both sides.
| Associated with Higher Odds of Persistent Unsustained Workforce Participation | Associated with Higher Odds of Persistent No-Record Status |
|---|---|
| Black identity. A strong, independent risk — tied for the largest instability gap in the analysis, and the only characteristic with a confirmed risk on both sides of this table. | American Indian identity. The single largest gap found in either model — a striking, independent risk. |
| Special Education status. A strong, independent risk, equal in size to the Black identity finding. | Taking the SAT. A large, independent risk, possibly reflecting graduates who left Minnesota rather than disconnected, though the data can’t distinguish the two. |
| Female gender. A real, independent risk factor for instability specifically. | English learner status. A large, independent risk — equal in size to the SAT finding. |
| Taking an AP exam. A modest but real independent risk — notable because AP participation was otherwise linked to higher college completion. | Asian/Pacific Islander identity. A real, independent risk, identical in size to the Hispanic and Black findings below. |
| Economic disadvantage. A modest but real independent risk factor for instability specifically. | Hispanic identity. A real, independent risk, identical in size to the Asian/PI finding. |
| Black identity. Also elevated here — the only characteristic with a confirmed risk on both sides of this table. | |
| Higher local wages. The smallest effect in either model, but a real, independent risk. |
Persistent Instability
The table above shows which characteristics carry an independent risk of persistent instability when all other factors are held constant, and we can calculate how large that risk is.
Five characteristics stood out in the analysis as independently linked to persistent instability, and the size of their effects varied meaningfully (Figure 20). Black identity and special education status showed the strongest associations, and the two were nearly identical in size. When all other factors were held constant, Black individuals faced a predicted 21% likelihood of persistent non-sustained employment, compared to 13% for otherwise similar White individuals, and graduates with a special education designation faced a 20% likelihood compared to 12% for those without one — in both cases an 8-point gap and roughly 1.6 times the risk. Gender told a similar though smaller story: female graduates faced a 16% predicted likelihood, 5 points higher than their male peers (11%). Taking an AP exam was also associated with a modestly higher risk (16% vs. 13%) — a counterintuitive result, given that AP participation was linked to a higher likelihood of completing a postsecondary credential. Among graduates who did not complete one, however, AP test-takers were somewhat more likely to end up in unstable work. Economic disadvantage rounded out the list with the smallest effect, as free or reduced-price lunch eligibility added 2 points of risk (14% vs. 12%). Even at the modest end, none of these gaps disappear once all other factors are accounted for — each one is an independent, standalone contributor to an individual’s risk of persistent instability.
Persistent No Minnesota Employment Record
On the other side of the table, how much does each characteristic contribute to someone’s odds of persistently disappearing from Minnesota’s employment records?
American Indian identity shows the largest gap of the group — a 33% likelihood of persistently having no Minnesota employment record compared to 19% for otherwise similar White graduates, a 14-point gap. Taking the SAT and English learner status show the next largest effects, each a 9-point gap: graduates who took the SAT had a predicted 29% likelihood compared to 20% for those who did not, and English learners had a 27% likelihood compared to 18% for otherwise similar non-English learners. Asian/Pacific Islander, Hispanic, and Black identity each show an identical, smaller gap — a 24% likelihood compared to 19% for otherwise similar White graduates, a 5-point difference. Local wages round out the list with the smallest effect: graduates from districts at the 90th percentile of local wages had a 21% likelihood compared to 19% for those from districts at the 10th percentile, a 2-point difference.
One More Factor: ACT Engagement
ACT engagement — whether someone took the ACT or not — is an anomaly in that its correlation to the risk of being disconnected isn’t a simple yes/no like the other characteristics. Whether it increases or decreases a person’s risk of ending up disconnected depends first on whether an individual took the test, then on what score they received. Not taking the ACT is associated with higher odds of persistent no-employment-record status compared to someone who took the test — taking it showed a clear protective relationship against that outcome. Persistent instability is different: taking the ACT showed no protective relationship, and among test-takers, the risk rose with score. Among students who did take the ACT, a higher score was associated with increased risk of both outcomes. Figure 21 shows this relationship. Among test-takers, predicted risk of persistent unsustained workforce participation (persistent instability) rose steadily from the lowest ACT scores to the highest, while predicted risk of persistent no-record status followed a similar upward path, rising steadily across the same range. For persistent no-record status, lower-scoring test-takers had less risk than otherwise similar graduates who never took the test, with that advantage disappearing at around a score of 26; for persistent instability, test-takers had somewhat higher risk than non-takers at every score. The two outcomes move together in parallel, suggesting that whatever is driving this pattern isn’t specific to one type of disconnection — it’s a broader relationship between stronger academic performance and reduced regional attachment that shows up consistently across outcomes. The data were clear on this phenomenon but could not reveal why it happened. Why this pattern holds — why stronger academic performance would be associated with greater risk among non-credential earners specifically — isn’t something this data can explain. It may reflect something about the pathway that leads a well-prepared student to not complete a credential in the first place, but it is worth flagging as a question for further investigation.Disparities Compound Across the Pipeline
The demographic characteristics identified in this pathway are not unique to non-credential earners. Recall from the Credential Earners’ Pathway that several of the same characteristics associated with elevated disconnection risk here were also associated with a lower likelihood of completing a postsecondary credential in the first place.
Special education, economically disadvantaged, Hispanic, and Black high school graduates all showed this pattern. Special education status and economic disadvantage showed the largest gaps, each 14 points: graduates with a special education designation had a predicted 40% likelihood of completing a postsecondary credential, compared to 54% for otherwise similar graduates without one, and graduates eligible for free or reduced-price lunch had a 43% likelihood compared to 57% for those who were not. Hispanic graduates showed a smaller gap (47% vs. 53% for otherwise similar White graduates), while Black graduates showed the most modest one (51% vs. 53%). Despite having the smallest completion gap, Black identity stands out as the only characteristic in this analysis associated with elevated risk at every stage examined: lower odds of completion and elevated odds of both persistent instability and persistent no-record status.
Taken together, these findings suggest that disparities along the pathway don’t operate as separate, one-time barriers. They compound. A graduate with one of these characteristics is less likely to complete a postsecondary credential, and in not completing one, joins the group where the same characteristic is again associated with a higher likelihood of disconnection from the workforce. The effect is cumulative: two gaps stacked on the same students, each independent of the other and each still present after accounting for everything else the model measures. This is especially relevant for special education and economic disadvantage, the two characteristics with the largest completion gaps, since both are identified in school records long before graduation. The students most likely to face disadvantages at both stages are, in other words, already known to the K–12 system, which makes high school a practical point to reach them before the gaps widen further.
What Offers Protection Against Disconnection?
Protections Against Persistent Instability
Among the many characteristics examined, five showed a confirmed, independent protective relationship against persistent instability: taking the SAT; attending postsecondary education, even without completing it; Hispanic identity; engaging in CTE as a concentrator; and graduating from an urban/town/rural mix school district.
Two of these stood out, each with a 4-point gap. Graduates who took the SAT had a predicted 9% likelihood of persistent instability, compared to 13% for otherwise similar graduates who did not. Individuals who attended some form of postsecondary education, even without finishing, had a predicted 11% likelihood, compared to 15% for otherwise similar graduates who never attended at all. This second finding makes intuitive sense. Even a partial postsecondary experience often comes with structured routines, career counseling, and connections to employers that a graduate heading straight into the workforce may never encounter. It may also reflect something more basic: the kind of planning and follow-through it takes to enroll in the first place tends to carry over into a steadier transition into work, whether or not the credential itself was ever finished.
The remaining three showed smaller protective effects. Hispanic graduates had an 11% likelihood of persistent instability compared to 13% for otherwise similar White graduates, and CTE concentrators had a 12% likelihood compared to 14% for graduates with no CTE background, each a 2-point difference. Graduating from an urban/town/rural mix district showed the smallest effect, 13% compared to 14% for graduates from town/rural mix districts.
The Hispanic identity finding is more complicated than it first appears. Hispanic graduates were less likely to have persistent workforce instability, but findings discussed earlier showed them less likely to complete a postsecondary credential (47% vs. 53%) and more likely to persistently have no Minnesota employment record (24% vs. 19%). Rather than a consistently positive or negative pattern, this group’s outcomes point in different directions at different stages: those who remain in Minnesota’s formal workforce appear somewhat more likely to find steady footing, even as the group as a whole faces barriers to completing a postsecondary credential and a higher likelihood of disappearing from the state’s records.
CTE concentration showed a modest protective effect — a predicted 12% likelihood of persistent instability, compared to 14% for graduates with no CTE background. Though small on its own, this finding fits a pattern seen throughout this report: CTE engagement consistently points toward stronger regional and workforce outcomes, whether measured through completing a credential at a regional institution, completing a credential at all, or protection from long-term instability among those who didn’t complete one.
Taking the SAT tied for the largest protective effect of the five — 9% compared to 13% for graduates who did not take it. But like Hispanic identity, taking the SAT cuts both ways. SAT-takers were more likely to persistently have no Minnesota employment record (29% vs. 20%), and earlier findings showed them more likely to complete their postsecondary credential outside the region. Taken together, these results describe a group that, when present in Minnesota’s workforce, tends to be steadily employed, but one that is also more likely to leave the region and the state altogether. For SAT-takers, a missing Minnesota employment record may more often reflect a move out of state than a disconnection from work.
Protections Against Persistent No MN Employment Record
While persistent instability showed five confirmed protective factors, no Minnesota employment record had seven (Figure 24).
Taking the ACT stands out sharply from everything else in this chart: a predicted 12% likelihood of persistent no-record status, compared to 31% for otherwise similar individuals who did not take the test. The 19-point gap is the largest identified in this pathway, more than twice the size of any other protective factor on the chart.
Attending college, even without completing a credential, showed the next-largest effect: a 14% likelihood compared to 23% for otherwise similar graduates who never attended, a 9-point gap. This mirrors the finding for persistent instability, where postsecondary attendance was also protective, making it one of the few characteristics associated with lower risk of both forms of disconnection.
CTE engagement showed a comparable effect, split across two levels of involvement: CTE Concentrators/Completers had a predicted 16% likelihood, compared to 25% for otherwise similar graduates with no CTE background (a 9-point gap), while CTE Participants showed a slightly smaller 7-point gap (18% vs. 25%) — demonstrating once again that CTE engagement tends to keep graduates connected to Minnesota’s workforce.
Economic disadvantage showed a protective effect of its own (17% vs. 23%, a 6-point gap), while graduating from a district in an entirely urban county (17% vs. 20%) and participating in PSEO (18% vs. 20%) showed smaller, though still real, effects.
A Local Opportunity
This distinction between non-sustained workforce participation and no Minnesota employment record matters. Because individuals with no Minnesota employment record have no employment data on file, we can’t say anything about where they might be working. But for the unsustained-workforce-participation group, we can understand where they are and what they’re doing, and that turns out to be a genuinely useful, actionable finding.
It turns out that, of the disconnected group in non-sustained workforce participation, nearly three-quarters (73%) were working in Southeast Minnesota, while the other 27% were working outside the region.
On the surface, the larger percentage of non-postsecondary credential earners with no Minnesota employment record might signal that graduates are leaving the region for better opportunities or that the region simply doesn’t have enough jobs.
But neither explanation holds up here: the non-postsecondary credential earners in unsustained workforce participation have Minnesota employment records; they are already here, working in Southeast Minnesota — just not at a level that reflects sustained workforce participation (working 1,000+ hours for the same employer in a particular year). These locally employed but potentially underutilized workers represent a meaningful opportunity, one that may be better addressed through strategies focused on job quality, advancement pathways, and retention rather than recruitment alone.
Key Insights and Implications
Earning a postsecondary credential is one of the strongest signs that a graduate will find steady work, and where they go to school matters more than what degree they earn. Graduates who finished any kind of postsecondary program were much more likely to have steady jobs, and those who finished that program in the region were far more likely to still be working there five years later. This holds true whether they earned a two-year or four-year degree. In other words, how strong and accessible the region’s own colleges are may matter more for keeping talent local than the type of degree those colleges offer.
The tests students take say a lot about where they’re headed. Taking the ACT was associated with the largest pull toward earning a credential in the region found anywhere in this analysis, and among students who didn’t earn a postsecondary credential, it was the strongest protection against falling off Minnesota’s employment records. Taking the SAT or an AP exam pointed the opposite direction: both were tied to earning a credential outside the region, and SAT-takers who didn’t earn a postsecondary credential were more likely to disappear from Minnesota’s records entirely, even as those who remained were less likely to be unstably employed. None of these tests explains why students leave or stay, but together they suggest that by the end of high school, many students have already signaled which way they’re leaning, something educators should be able to see.
Career and Technical Education is the most consistent anchor to the region found anywhere in this analysis. CTE was tied to:
- Earning a postsecondary credential at a regional school;
- A modestly higher likelihood of earning a postsecondary credential at all;
- Steady regional employment among graduates who didn’t earn a credential after high school, especially in the first few years after high school;
- Lower odds of having persistent instability in workforce participation, and
- Lower odds of falling off Minnesota’s employment records for good.
No other high school experience points as consistently toward staying in — and staying visible in — the region’s workforce. Unlike in some other regions, CTE concentration in Southeast Minnesota was also associated with a small advantage in completing a postsecondary credential, a reminder that CTE is not a path away from college. Its strongest effects, though, are about where someone ends up. This suggests that investing in strong, well-connected CTE programs may be one of the best ways to improve outcomes for a wide range of students, not just those heading straight into the workforce.
For most groups, barriers pile up along the pipeline, but not for everyone, and not always in the same direction. Students with a Special Education designation and students facing economic hardship showed the largest gaps in finishing college — 14 points each — and both also faced a higher risk of unstable work among those who didn’t finish. Black students were the only group associated with elevated risk at every stage examined: lower odds of earning a postsecondary credential and higher odds of both persistent unstable work and persistently having no Minnesota employment record. For these groups, these aren’t separate problems showing up at different times — they’re the same underlying issue showing up repeatedly across time.
Several findings break that pattern, though, and are worth calling out directly:
- American Indian students showed no confirmed gap in finishing college in this region, but among credential earners they were the group most strongly pulled toward finishing outside the region, and among those who didn’t finish, they faced the highest risk of persistently having no Minnesota employment record. For this group, the gap seems to show up mainly in where students end up — and whether they remain visible in Minnesota’s workforce at all.
- Economic hardship cuts both ways. It lowers the odds of earning a postsecondary credential and raises the risk of unstable work, but it actually lowers the odds of falling off Minnesota’s employment records entirely, and among credential earners it was tied to finishing in the region.
- Hispanic and English Learner students show mixed patterns. Hispanic students faced lower odds of earning a credential after high school and higher odds of having no Minnesota employment record, but lower odds of unstable work. English Learners were more likely than their peers to earn a credential after high school, yet among those who didn’t finish, more likely to have no Minnesota record.
Disconnection isn’t a single problem, and neither is disadvantage. These findings are a reminder that disadvantage doesn’t operate in just one direction, and disconnection isn’t a single problem with a single cause. The same characteristic can raise one kind of risk while lowering another, and a barrier at one stage of the pipeline doesn’t automatically mean a barrier at every stage.
Some postsecondary education exposure — even without finishing — helps on both fronts. Among students who didn’t earn a credential, simply attending some kind of postsecondary program was tied to both a lower risk of unstable work and a lower risk of falling off Minnesota’s employment records. That makes it one of the few characteristics in this analysis associated with protection against both forms of long-term disconnection. It points to a real opportunity: helping more students access and stick with some college, even if they don’t finish, may pay off for their long-term connection to work.
The disconnected are already here. Among students who didn’t earn a credential, about 25% were employed but below the threshold for sustained workforce participation five years after high school. The large majority of that group — 73% — were working within Southeast Minnesota itself, not elsewhere in the state. That means the real challenge isn’t finding or attracting workers from outside the region. It’s helping people who are already working here move into steadier, more substantial work.
In Southeast Minnesota, “no Minnesota employment record” mostly looks like genuine disconnection. Unlike regions that border large out-of-state institutions and job markets, Southeast Minnesota’s rate of non-postsecondary credential earners with no Minnesota employment record (28.1%) is only about 6 points higher than the regional benchmark for adults with only a high school diploma would predict. Some share likely reflects graduates working across the Wisconsin or Iowa border or working for themselves, but the gap is modest. That makes the no-record group in this region less a data artifact and more a real population — one that, given the characteristics identified here, could largely be identified while still in high school.
In closing
Southeast Minnesota’s path from high school to the workforce isn’t broken, but it isn’t smooth and problem-free either. For graduates who finish college in the region, the road to a stable, local job is fairly clear; that holds true whether they earn a two-year or four-year degree. For those who go straight into the workforce, hands-on career training in high school makes a real difference, but not every student is taking advantage of — or has access to — the opportunity. And for those who end up disconnected long-term, the barriers are structural, tend to build on each other for most (though not all) groups, and are easy to miss if you’re only looking at one moment in time instead of the whole path.
This report doesn’t solve these problems. But it does show where they’re most concentrated, who’s carrying the biggest burden, and where a closer look might make the biggest difference. That’s the starting point for a better conversation about how Southeast Minnesota invests in its young people — and in the systems meant to carry them from school into work.
Appendix
Limitations
This analysis, like all research based on administrative data, has real limits worth stating plainly.
These findings describe patterns, not complete explanations. The characteristics discussed in this report explain some, but not all, of why graduates’ paths differ. Many things that shape a person’s life and career — family circumstances, personal choices, specific employers, health, and countless other factors — are not captured in this dataset. The percentages in this report reflect what these particular, measurable characteristics can predict on average. They are not a full accounting of any individual graduate’s story, and they should not be read as a prediction about any specific person.
Some data does not fully capture what it appears to measure. For example, a “no Minnesota employment record” does not always mean someone is disconnected from the workforce — it can also reflect a graduate who moved out of state for work or school. We’ve noted these ambiguities directly wherever they affect how a finding should be interpreted.
A small number of characteristics we originally considered were excluded from this analysis due to data quality concerns. Most notably, we chose not to include Minnesota Comprehensive Assessment (MCA) proficiency scores as a factor in our models. We found that missing MCA scores were far more common among English language learner students than other students, and there was no reliable way to determine whether that pattern reflected something meaningful about a student’s circumstances or simply a gap in how the data were recorded. Rather than risk drawing a conclusion from an unreliable measure, we excluded it from our analysis entirely.
Some findings are based on small numbers of individuals and should be treated with appropriate caution. Where a specific comparison involves a small group of graduates, we’ve noted that directly rather than presenting it with the same confidence as findings based on larger groups.
Methodology
Data and Population
This report draws on linked, anonymized administrative records provided by the State of Minnesota, combining three sources: high school records (courses, CTE participation, MCA and ACT scores, and demographic indicators), postsecondary records from Minnesota’s public higher education systems and the National Student Clearinghouse (capturing both in-state and out-of-state enrollment and completion), and Minnesota employment records from the Department of Employment and Economic Development (DEED), which capture wages, hours, and employer attachment for work performed within Minnesota.
The analysis covers 122,938 individuals who graduated from high schools in Southeast Minnesota — defined as Economic Development Regions 9 (South Central) and 10 (Southeast) — between 2008 and 2023. Individual analyses within the report sometimes restrict this population further depending on the question being asked (for example, models predicting outcomes five years after graduation exclude students who graduated too recently to have five years of data), and each figure’s caption or surrounding text notes when a subset is being used.
Outcome Categories
Each graduate’s status was assessed annually and assigned to one of five mutually exclusive categories: Sustained Workforce Participation–Southeast (1,000+ hours in a year with a single employer within the region), Sustained Workforce Participation–Minnesota (the same threshold, met elsewhere in the state), Non-sustained Workforce Participation (some Minnesota employment, but below the sustained threshold, and not enrolled in school), Attending Postsecondary, and No Minnesota Employment Record (no observed Minnesota employment or enrollment for that year). As discussed throughout the report, this last category is not synonymous with disconnection — it also captures out-of-state employment, military service, federal employment, and other circumstances Minnesota’s records cannot observe.
Analytical Approach
The analysis proceeded in two stages for each research question. First, bivariate relationships — the association between a single characteristic and an outcome, considered on its own — were examined descriptively to identify candidate characteristics worth testing further. Second, characteristics that showed a bivariate relationship were tested together in multivariate logistic regression models, which estimate each characteristic’s association with an outcome while holding all other characteristics in the model constant. This second step is what allows the report to describe a relationship as “independent” — meaning it held up even after accounting for a graduate’s other measured characteristics, rather than simply reflecting overlap with some other factor (for example, a raw gap between two groups that actually stems from one group having higher rates of PSEO participation, rather than group membership itself).
A characteristic is described in this report as significantly associated with an outcome only if the relationship met a standard statistical threshold (p < .05) in these multivariate models, meaning there is less than a 5% probability that a relationship of this size would appear by chance if no real relationship existed. Characteristics that did not meet this threshold are not reported as findings, even where an earlier bivariate relationship appeared to exist.
Reading “Predicted Likelihood” Figures
Many figures in this report show a “predicted likelihood” for two groups — a graduate with a given characteristic and an otherwise similar graduate without it. These are not raw, observed rates. They are model-based estimates, generated by holding a characteristic at each of its two values in turn (for example, Gender = Female, then Gender = Male) while leaving every other characteristic in the model at each individual’s actual recorded value, then averaging the resulting predictions across the full population. This approach — sometimes called average marginal prediction or marginal standardization — produces a like-for-like comparison: the difference between the two predicted values reflects the association of that one characteristic alone, net of everything else the model accounts for, rather than a raw gap that might be driven by differences in the two groups’ other characteristics.
For two continuous characteristics examined in this report — local wages and local unemployment rate — “predicted likelihood” comparisons use the 10th and 90th percentile of that measure across the region’s school districts, rather than an all-or-nothing comparison, to avoid a small number of extreme districts driving the result.
Tracking Persistence Over Time
For the Disconnected Pathway specifically, graduates who did not complete a postsecondary credential were tracked across the first five years following their exit from formal education (high school for those who never attended college; the point of leaving college for those who attended without completing). Based on how many of those five years a graduate spent disconnected — in either non-sustained employment or with no Minnesota employment record — graduates were grouped into four categories: Consistently Attached (disconnected in 0 of 5 years), Intermittently Disconnected (1–2 years), Broadly Disconnected (3 years), and Persistently Disconnected (4–5 years). This categorization made it possible to distinguish a temporary post-graduation adjustment period from a longer-term pattern.
A Note on Association, Not Causation
Every relationship described in this report is an association, not a demonstrated cause. The characteristics examined here are not the only things that shape a graduate’s path — family circumstances, individual choices, specific local employers, health, and countless other factors that this dataset cannot capture all play a role. A relationship holding up across multiple statistical controls increases confidence that it reflects something real and not merely a coincidence of overlapping characteristics, but it does not establish that changing one characteristic would, on its own, change a graduate’s outcome.
1 Note on the source of the 21.8% benchmark: This figure is the share of Southeast Minnesota adults ages 25 to 64 whose highest level of education is a high school diploma (including equivalency) who are not in the labor force, summed across the 20 counties of Economic Development Regions 9 and 10 (19,971 of 91,423; margin of error ±0.9 percentage points), from the U.S. Census Bureau, American Community Survey 2020–2024 5-Year Estimates, Table B23006. The comparison is approximate. The ACS measures current residents of the region rather than everyone who graduated from its high schools, covers a broader age range than the graduates examined here, and measures labor force participation rather than the presence of a Minnesota employment record. In addition, some non-credential earners attended college without completing a credential; adults in the region with some college or an associate’s degree have a lower non-participation rate (14.4%), so the true benchmark for this group may be somewhat below 21.8%, and the gap somewhat larger than 6 points. Neither cross-border employment in Wisconsin or Iowa nor self-employment can be observed in Minnesota’s employer-reported wage records, so the exact share of the gap they account for cannot be determined from this data alone. ↩