
February 13, 2019
By Kelly Asche, Research Associate
Each year, the Center for Rural Policy and Development provides a brief report on various economic and demographic conditions in rural Minnesota. The State of Rural Minnesota 2019 provides data points both current and historical, illustrating how rural conditions have changed and where they are at now. We also maintain our Atlas of Minnesota Online, an interactive collection of maps and charts that shows readers this data broken down in different ways.
One of the reasons we decided to start a blog was that it gives us an opportunity to go a little deeper into some of our research. Sometimes as we’re digging into the data and the information on a topic, we find something really interesting, but unfortunately, it’s too small or too narrow or a little too off-topic to be included in the main report. But it’s also too interesting to just ignore.
With this blog, though, we can take those interesting bits and give them their moment in the spotlight.
One of those interesting bits is the population trends in Nobles and Mower counties. Probably one of the most discussed trends when talking about our rural areas is population. Although it’s no secret that population continues to grow in metropolitan areas across Minnesota, perhaps a little less well understood is how population trends play out throughout non-metropolitan areas.
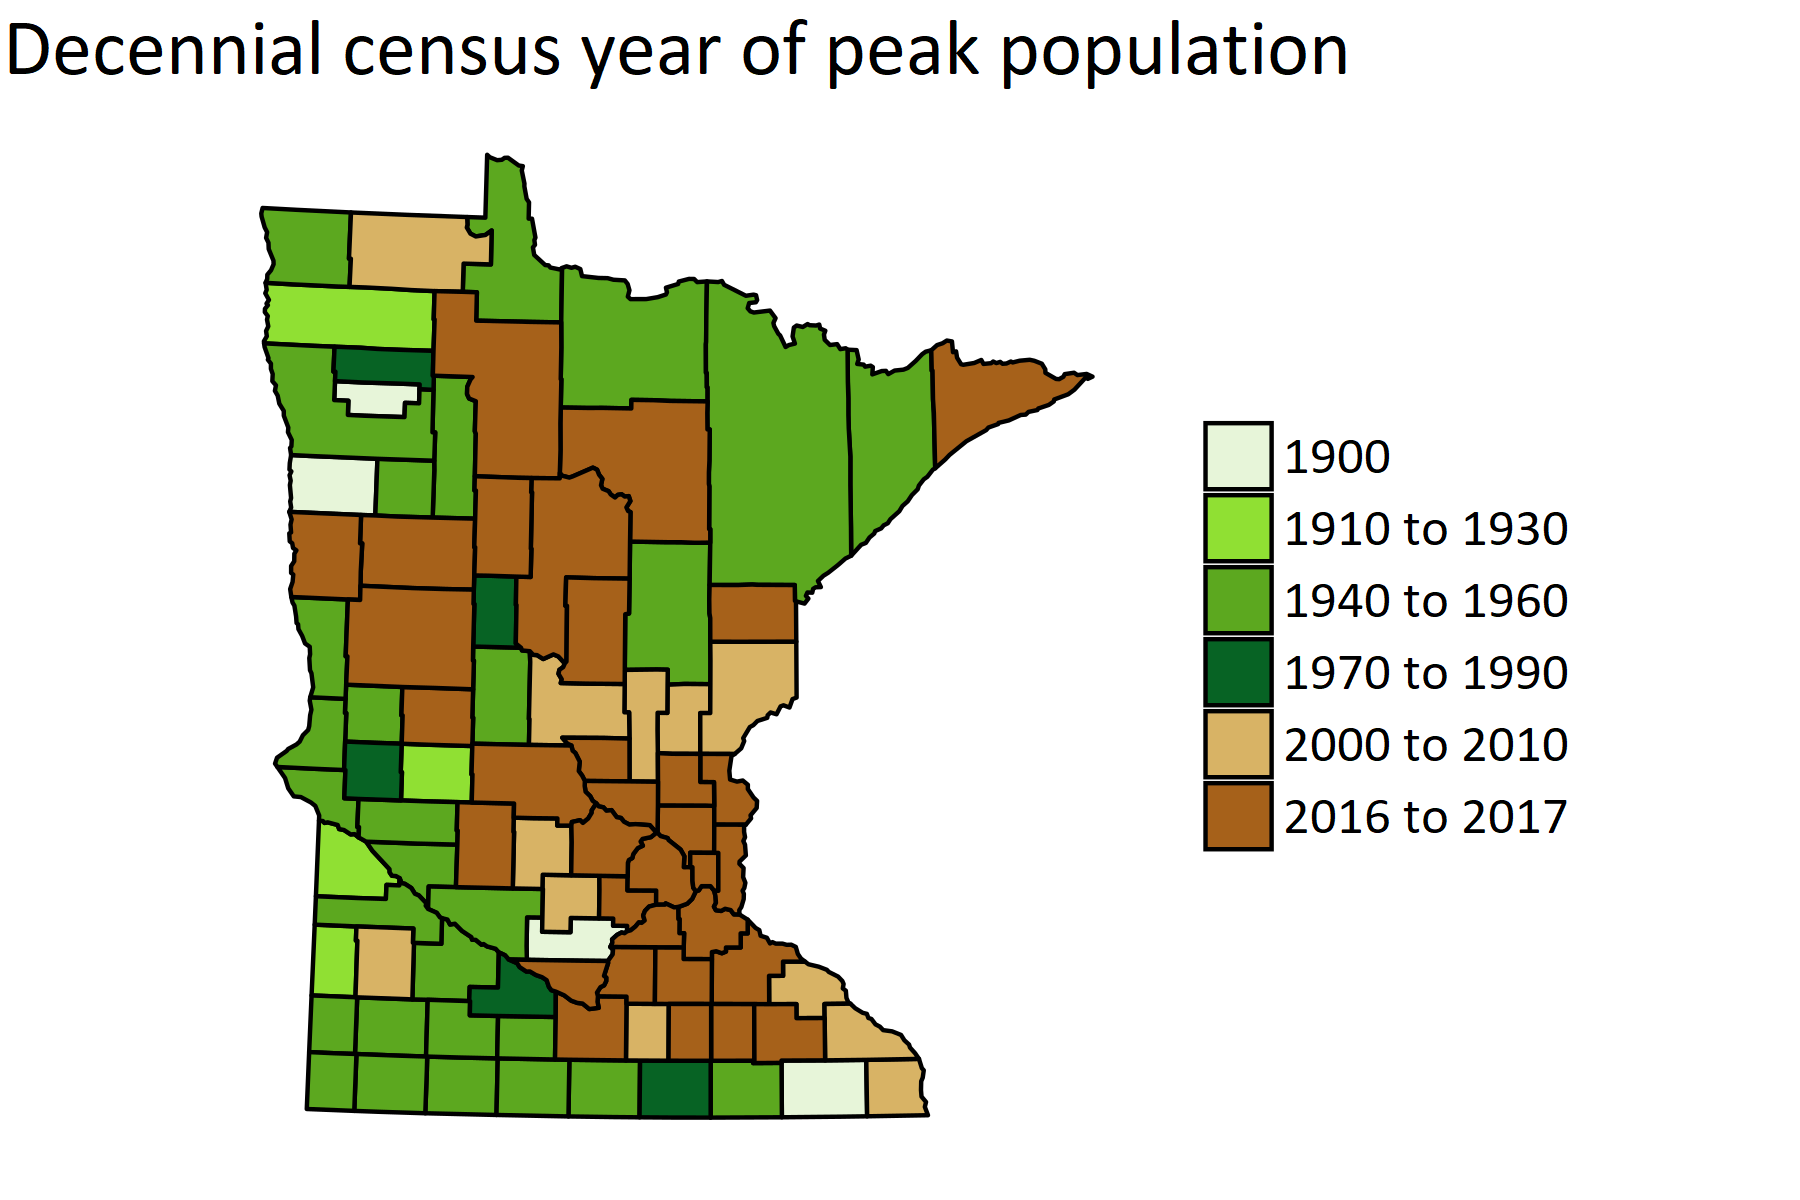
Let’s start with some historical context. The map below shows the census year of peak population in each county since the 1900 census (Figure 1). It’s easy to see that most of Minnesota’s counties (over 80%) fall into two population trends: their population is either peaking today or it peaked 60 plus years ago (1960 or earlier).
The counties that have recorded their highest population numbers in the last few years are those surrounding Minneapolis-St.Paul, stretching out west to St. Cloud and down south to Rochester and Mankato. In Greater Minnesota, the counties peaking now are generally concentrated in northern and central Minnesota’s “lakes country,” such as Otter Tail County and the Detroit Lakes and Brainerd Lakes regions.
Nearly all the other counties in the state experienced their peak populations at the 1960 decennial census or earlier, and most of these counties are located along the North Dakota, South Dakota, and Iowa borders. These counties are far enough away from the seven-country metro region that they are not impacted by spillover from the metro’s population growth, while they are also not generally thought of as recreational counties with lakes.
However, just looking at peak population hides some of the interesting trends happening in these counties. When we look a little deeper, we see there’s more going on.
Since peaking in the 1950s and 1960s, many counties in southwest Minnesota have seen their populations decrease with the release of every subsequent decennial census. After a few decades of decline, however, the in-migration of immigrant and refugee populations into some of these counties is turning that trend around.
For example, check out the historical populations for Nobles and Mower counties along Minnesota’s border with Iowa. Both saw their population peaks in 1960 followed by 30 years of population decline. Beginning in the 1990s, though, the population began increasing again (Figure 2).
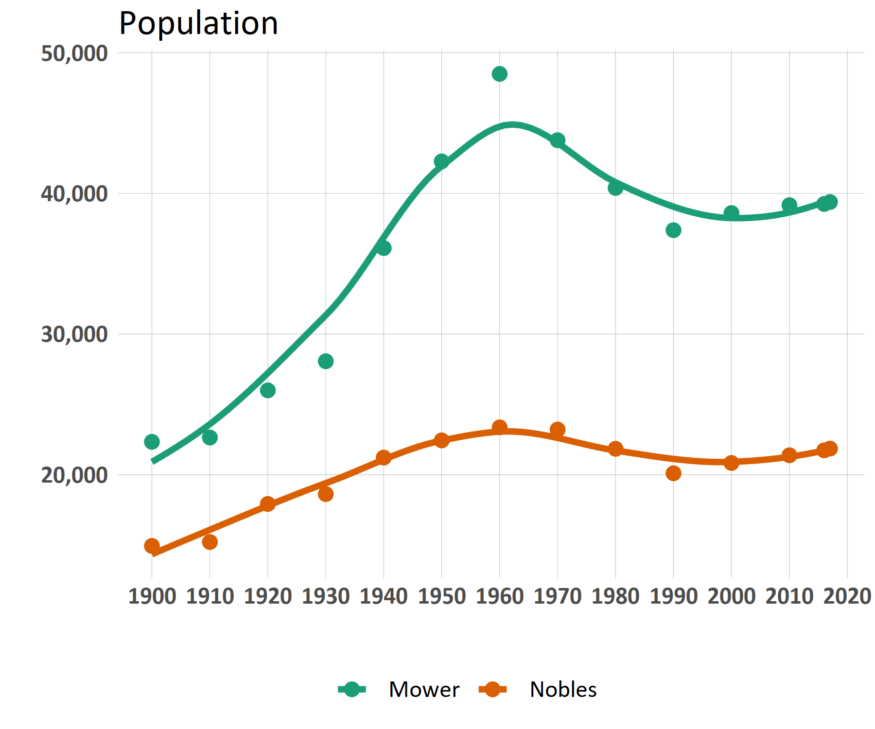
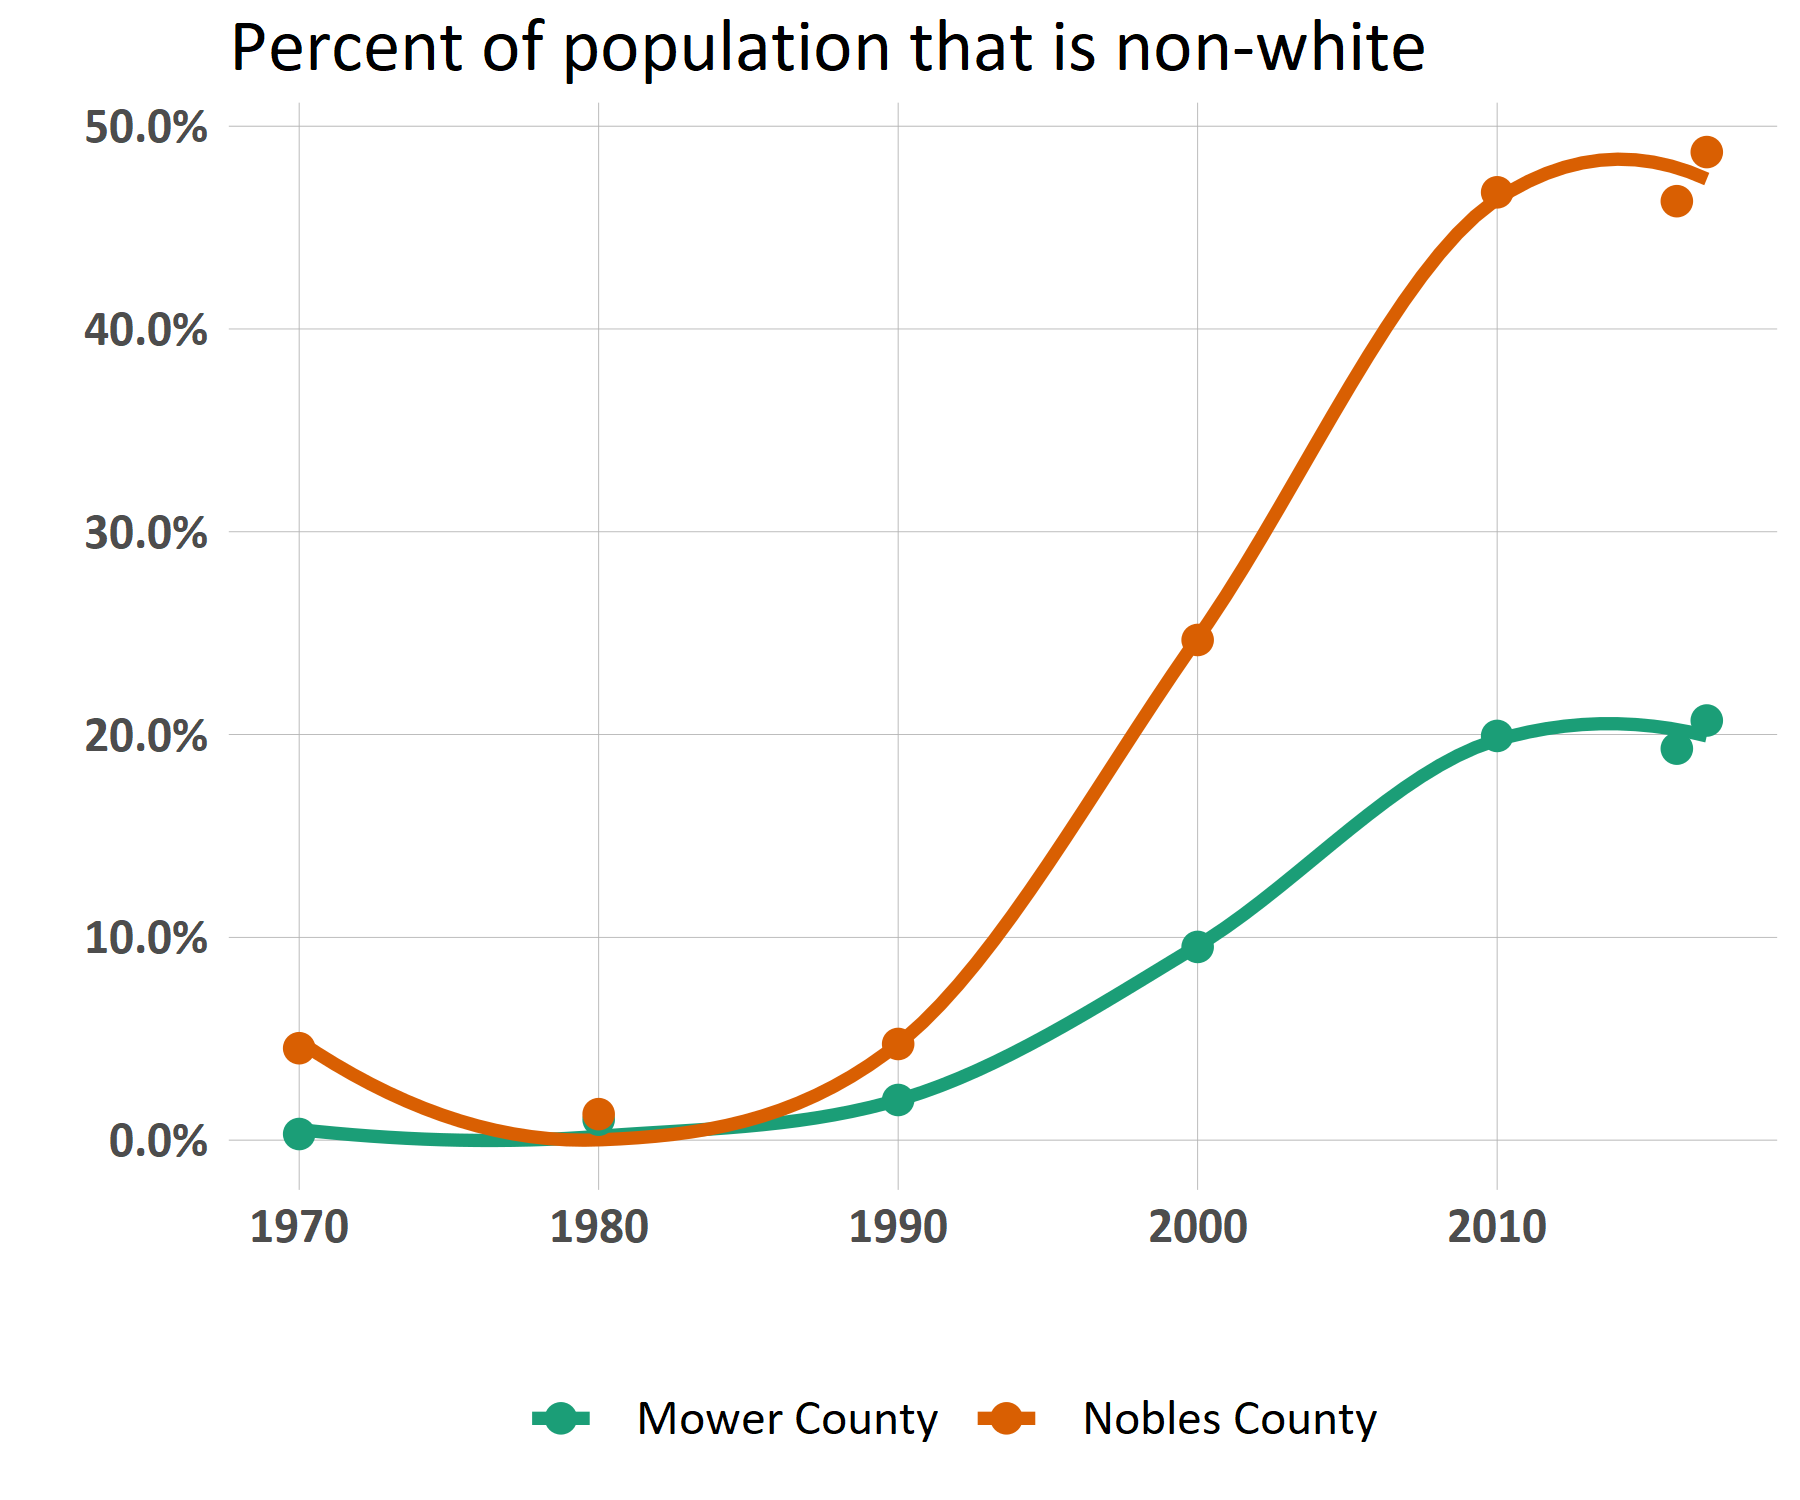
During that decade, the percentage of residents identifying as something other than white, non-Hispanic began increasing. In Nobles County, the number of non-white, Hispanic, or Latino residents as a percentage of total population increased from 4.5% in 1990 to 48.7% in the 2017 estimates. In Mower County, it increased from 2.0% in 1990 to 20.7% in the 2017 estimates. What’s more, this in-migration has driven up these counties’ overall populations and has done so within a region where nearly all other counties are experiencing population declines.
The table below provides a bit more detail. Between 1980 and 1990, Nobles County was losing on average 167 people per year while people identifying as something other than white, non-Hispanic increased by only 67 people per year. During the 1990’s, that number increased to 418 people per year and with it, the county’s total population began increasing by 73 people per year. This trend continued between 2000 and 2010 but has slowed significantly between 2010 and 2017. A similar trend occurred in Mower County as well (see the second table below).
Nobles County
| Year | Average annual change in total population | Average annual change in non-white, Hispanic or Latino population |
| 1970-1980 | -144 people per year | -77 people per year |
| 1980-1990 | -167 people per year | 67 people per year |
| 1990-2000 | 73 people per year | 418 people per year |
| 2000-2010 | 55 people per year | 485 people per year |
| 2010-2017 | 68 people per year | 94 people per year |
Mower County
| Year | Average annual change in total population | Average annual change in non-white, Hispanic or Latino population |
| 1970-1980 | -343 people per year | 28 people per year |
| 1980-1990 | -296 people per year | 33 people per year |
| 1990-2000 | 122 people per year | 294 people per year |
| 2000-2010 | 56 people per year | 413 people per year |
| 2010-2017 | 32 people per year | 49 people per year |
These charts show the dynamic nature of our counties in Greater Minnesota. They are not stagnant areas nor are they all experiencing similar population trends. Rather, they are places with unique and interesting demographic changes that require discussions focused on their individual characteristics and not lumped into general “rural” narratives.
To see the 2019 State of Rural Minnesota report, click here. To see charts for other counties and more detailed information, check out the Atlas of Minnesota Online at www.ruralmn.org/rural-atlas.