

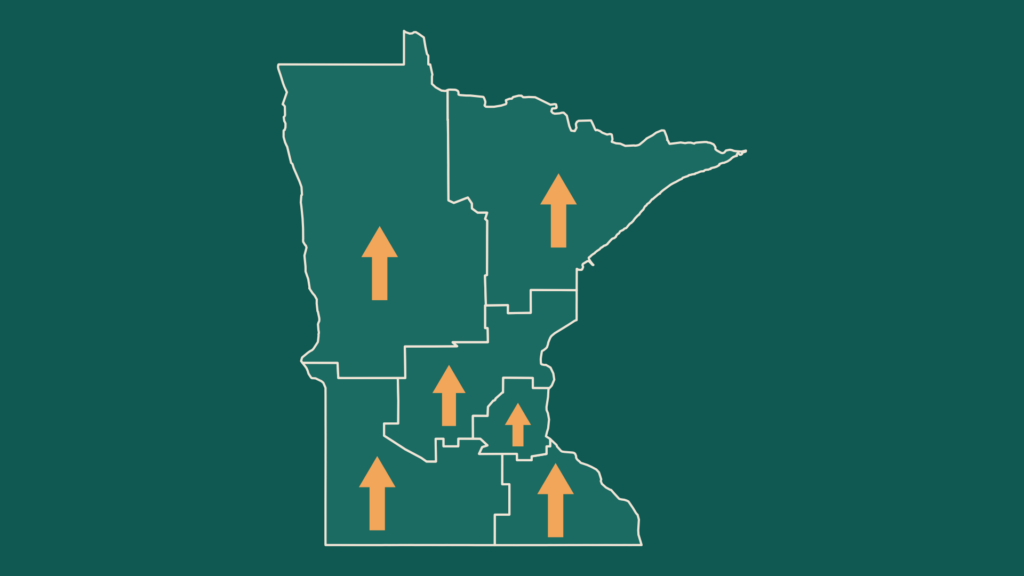
Unemployment rates are up in every region of the state since 2022, but the regional gaps behind those numbers are nothing new.
October 2026
This is the second in a series of teasers leading up to our State of Rural 2027 report. Last month, we looked at the quiet driver of rural Minnesota’s population trends: births and deaths. This time, we’re turning to the economy, and specifically to a number that has been drawing more attention this year: the unemployment rate.
The Minnesota Department of Employment and Economic Development (DEED) has been tracking the shift closely. In its June analysis, Signs of Stress: Minnesota’s Labor Market 2026, DEED reported that Minnesota’s unemployment rate rose nearly a full percentage point over the year, to 4.5% in April. Over the same period, the share of Minnesotans participating in the labor force fell by about the same amount. Nationally, the unemployment rate barely moved. Since January, Minnesota’s rate has been running higher than the national rate, which DEED notes is unusual for a state that has long outperformed the country on this measure.
Most of the coverage so far has focused on the statewide rate and how it compares with the nation. But unemployment is ultimately a regional story, shaped by the industries and occupations that anchor each local economy. A mining slowdown in the Northeast and a shift in food processing in the Southwest can both push the statewide number up while having very different causes. So instead of our usual rural-urban county groupings, this post looks at Minnesota’s planning regions and economic development regions (EDRs) to show where unemployment is actually rising.
Unemployment Is Rising Everywhere, Not Just in a Few Places
Start with the big picture. After reaching historic lows in 2022, unemployment rates have risen in every one of Minnesota’s planning regions (Figure 1). The increases are remarkably similar: from 1.3 percentage points in the Southeast to 1.7 points in the Northwest and Central regions. Most of that increase happened in a single year. Between 2024 and 2025, every region’s rate rose by 0.7 to 1.1 points.
That uniformity matters. If the rise were being driven by trouble in one industry, we would expect it to show up sharply in the regions that depend on that industry and barely register elsewhere. Instead, the 2025 data look more like a statewide shift that every region is feeling at about the same pace.
It’s also worth keeping the increase in perspective. In 2025, rates ranged from 3.6% in the Seven County Metro and the Southeast to 5.0% in the Northeast, roughly where they stood in 2015. They remain well below the post-recession rates of 2012, when every region was above 5% and the Northeast was near 7%.
One more pattern stands out when we compare today’s rates with 2019, the last year before the pandemic. The Seven County Metro has drifted furthest from its pre-pandemic rate, sitting 0.7 points above where it was in 2019. The Northwest and Northeast are only 0.3 and 0.4 points above their 2019 rates. Greater Minnesota still has higher unemployment than the metro, but the gap has narrowed, in part because the metro has lost more ground since the pandemic.
A Closer Look: The Northern Band Stands Out
Planning regions can still hide a lot of variation, so Figure 2 breaks them down into Minnesota’s economic development regions (EDRs). The Northeast and Southeast planning regions are each a single EDR (Arrowhead and Southeast), so their numbers are the same in both figures.
The clearest pattern is geographic. A band of EDRs across northern and east-central Minnesota has the highest rates in the state: Headwaters (5.7%), East Central (5.6%), North Central (5.4%), and the Arrowhead (5.0%). That isn’t new. The same EDRs had the highest rates in 2012, 2016, and 2019, which suggests the gap reflects long-standing differences in these regional economies more than anything that happened in the last year. Many of these areas depend on seasonal industries such as tourism, construction, and forestry, which add workers in the summer and lay them off in the winter. Even in annual averages, those winter layoffs push rates higher, and many of those workers are likely on temporary layoff waiting to be called back. So a higher unemployment rate in these regions doesn’t necessarily mean there are more people available to fill open jobs.
The EDR view also shows how much variation sits inside a single planning region. Within the Northwest planning region, unemployment ranges from 4.0% in West Central to 5.7% in Headwaters, a gap larger than the difference between the Northwest and the metro. At the other end, the three EDRs that make up the Southwest planning region (Upper Minnesota Valley, Southwest, and South Central) have tracked close to the metro for most of the past decade and sit between 3.9% and 4.3% today.
One EDR deserves a closer look. East Central, which includes Chisago, Isanti, Kanabec, Mille Lacs, and Pine counties, saw the largest increase of any EDR since 2022 (+2.2 points) and is 0.9 points above its 2019 rate, the largest gap from pre-pandemic levels of any EDR in Greater Minnesota. That increase isn’t the product of a single county. Kanabec, Pine, Mille Lacs, and Isanti counties are each a full percentage point above their 2019 unemployment rates, and Kanabec (7.6%) and Pine (7.2%) now have the second- and third-highest rates in the state. Only Chisago County, the most closely tied to the Twin Cities, has seen a smaller increase. Understanding what is driving that shift will be one of the questions we take up in the full State of Rural 2027 report.
What Comes Next
Taken together, the data tell a fairly clear story. Unemployment is rising across all of Minnesota, not just in a few regions, and most of that increase came in the last year. The regional differences that do exist, particularly the higher rates across northern and east-central Minnesota, are long-standing and reflect differences in regional economies that predate the current rise. And while rates are climbing, they remain roughly where they were a decade ago and well below the levels Minnesota saw in the early 2010s.
What the unemployment rate can’t tell us is whether rural employers are still struggling to find workers. In our 2026 State of Rural report, job vacancy rates in Greater Minnesota remained well above what is considered healthy, and the Northeast had the highest vacancy rate in the state. If vacancies remain high while unemployment rises, the challenge isn’t a lack of jobs. It’s a mismatch between the jobs available and the people looking for work, whether in skills, location, or industry. That calls for a very different policy response than a downturn in demand for workers.
The 2025 job vacancy data aren’t available yet, but we’ll take up that question in the full State of Rural 2027 report, along with a closer look at the industries behind these trends.