
Back in 2013, the Center released a report and fact sheet on the future of highway funding for Greater Minnesota, Roads Less Traveled: How emerging issues are creating hazards for rural highway funding.[1] The report and its accompanying fact sheet, Rough Roads Ahead, discussed how policy changes and our own driving habits are shaping the future of highway funding for rural areas.
We’re taking a brief look at the topic of highway funding again, this time from the perspective of county roads. We have almost 45,000 miles of county highways in Minnesota. They make up one third of our roads, and 69% of their miles are designated County State-Aid Highways (CSAH). CSAH highways have been deemed important enough to the state’s overall well-being that state government contributes funding to their maintenance, but counties are ultimately responsible for the upkeep of all county roads.[2]
With transportation funding in the precarious position it has been in for the last few years, the legislature has given counties the option of using an additional tool to fund roads locally in the form of a local-option sales and use tax.[3] As of June 2017, 27 counties[4] have opted for this tax that focuses on roads, bridges, public transit, and Safe Routes to School projects (fig. 1).
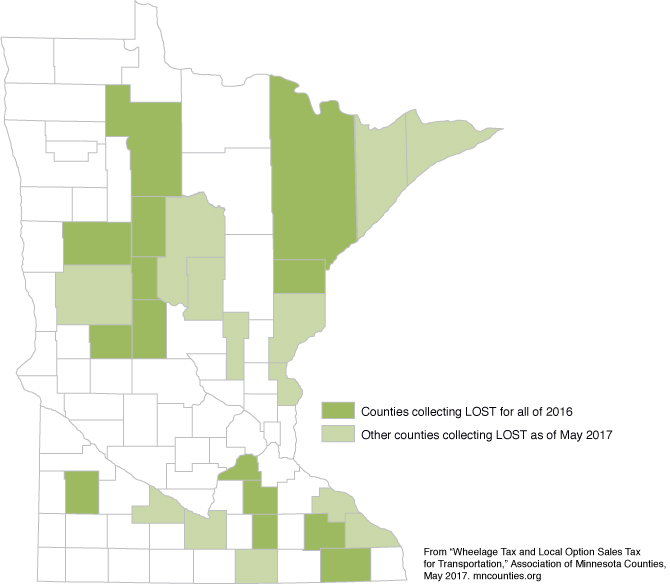
While it’s still relatively new, we can get an idea of how the local option sales and use tax is working out for counties by looking at the 14 counties that collected this tax revenue for all of 2016. We can also get an idea of how this new policy of supporting roads through local sales and use taxes in addition to state funding will work out for counties of various sizes.
Rising costs and flat revenue
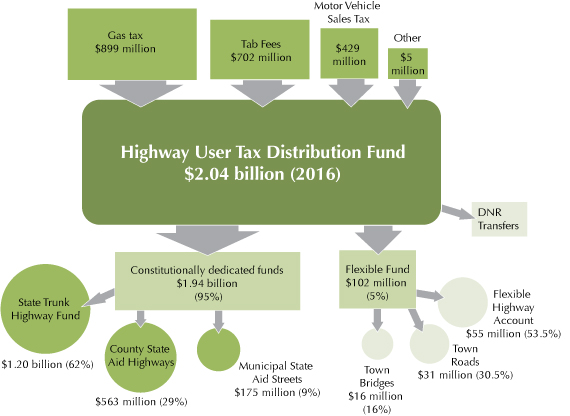
Funding for CSAH roads comes from the Highway User Tax Distribution Fund, which is funded from the state gas tax, the state motor vehicle sales tax and tab fees. The formula is specified in Minnesota’s constitution (fig. 2).
As we showed in Rough Roads Ahead, the gas tax, the state’s—and federal government’s—primary source of revenue for road funding has flattened out. The pattern has continued, even with a gas tax increase in 2012 (fig. 3), due to a combination of reasons, including changing driving habits and increasing fuel efficiency in cars.
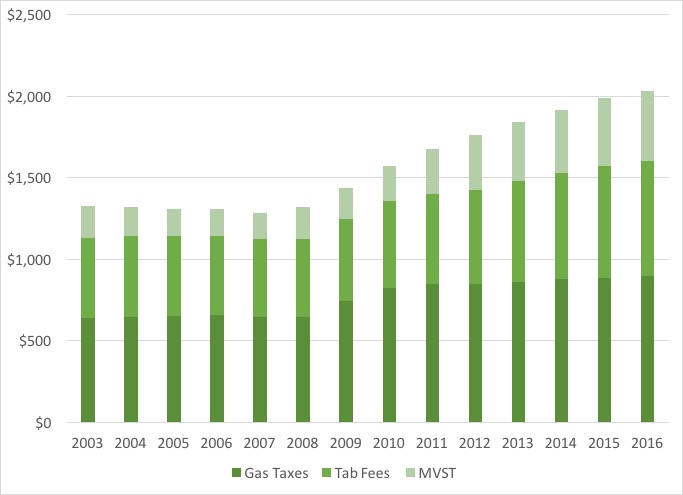
At the same time, collections of motor vehicle sales taxes and tab fees, which also contribute to the HUTD, have been rising steadily. Have they been going up enough to make up for the lack of growth in gas tax revenues or to keep up with the cost of road construction, though?
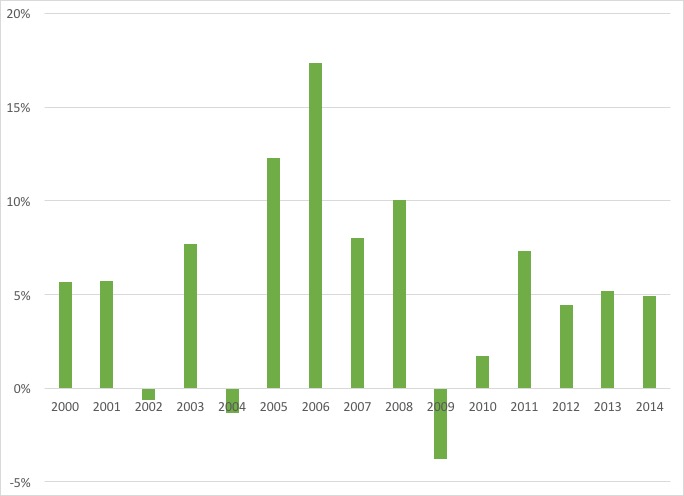
The highway construction cost index (fig. 4) prepared by the Minnesota Department of Transportation indicates that there were substantial increases in the cost of road construction in the 2000s, including year-over-year increases of 12%, 17%, 8% and 10% for 2005, 2006, 2007 and 2008 respectively. From 2003 to 2014, the cost of road construction rose 87% or at an average annual rate of 5.9%. In the same time period, the HUTD’s annual collections increased 45%, for an average rate of 3.4% a year.
Non-CSAH highways are maintained using funds from county property taxes. Beltrami County, for example, levies about $2.25 million a year in property taxes for roads and bridges, “but a huge chunk of that goes just to keeping county roads in good shape as well as state-aid highways,” says Beltrami County Administrator Kay Mack. The combination of funding the county receives from the state, local property taxes and sometimes federal dollars has not been enough to keep roads in good repair, she says.
“Once they start deteriorating, they just deteriorate at a faster rate,” Mack says.
Add to that the complication of no transportation funding bill in 2016, which meant no increase in funding regardless of inflation. When Beltrami County officials presented the option in 2013 of an additional 0.5% sales tax alongside other road funding options to residents at listening sessions, the decision to approve the sales and use tax was not difficult, Mack said.
In 2016, Beltrami County collected $3,658,646 in local-option sales and use taxes for transportation funding, according to the Minnesota Department of Revenue.[5]
Population and retail
Beltrami County, however, turns out to be something of an anomaly in this group. The fourteen counties in the table below collected transportation sales and use tax for all of 2016. The counties all differ in population, area, and their capacity to raise sales and use tax revenue.
|
County |
Total transportation sales & use tax collected in 2016 (MN Dept. of Revenue) |
Total county road lane miles (CSAH and non-CSAH lane miles, MnDOT) |
Transportation sales & use tax revenue per county lane mile (2016) |
County population (US Census, 2015 est.) |
Pop density (residents per sq. mile) |
|
Scott Co |
$8,561,335 |
745 |
$11,498 |
143,680 |
403 |
|
Olmsted Co |
$6,678,702 |
1,092 |
$6,117 |
153,102 |
234 |
|
Rice Co |
$3,248,747 |
875 |
$3,713 |
65,622 |
132 |
|
Steele Co |
$2,535,267 |
721 |
$3,518 |
36,805 |
86 |
|
Douglas Co |
$3,227,977 |
1,097 |
$2,942 |
37,456 |
59 |
|
Carlton Co |
$1,727,802 |
973 |
$1,776 |
35,738 |
42 |
|
Lyon Co |
$1,868,381 |
966 |
$1,934 |
25,699 |
36 |
|
St. Louis Co |
$14,198,464 |
5,698 |
$2,492 |
199,980 |
32 |
|
Fillmore Co |
$850,283 |
957 |
$888 |
21,003 |
31 |
|
Becker Co |
$2,186,818 |
1,326 |
$1,650 |
33,734 |
26 |
|
Todd Co |
$722,674 |
1,246 |
$580 |
24,233 |
26 |
|
Wadena Co |
$684,352 |
867 |
$789 |
13,761 |
26 |
|
Hubbard Co |
$929,720 |
1,039 |
$895 |
20,718 |
22 |
|
Beltrami Co |
$3,658,646 |
1,430 |
$2,558 |
46,106 |
18 |
Table 1: Minnesota counties that collected the transportation sales and use tax for all of 2016, sorted by population density.
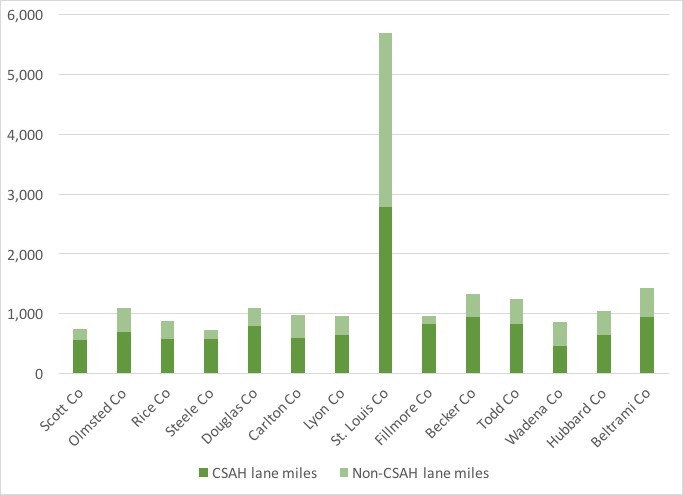
Except for St. Louis County, which has almost 5,700 lane miles of county roads, all the counties in the group have between 700 and 1,500 lane miles of county highways (CSAH and non-CSAH combined, fig. 5). If the counties are ranked by population density, the correlation between that and the amount of revenue collected per county lane mile is apparent (figs. 6a and 6b).
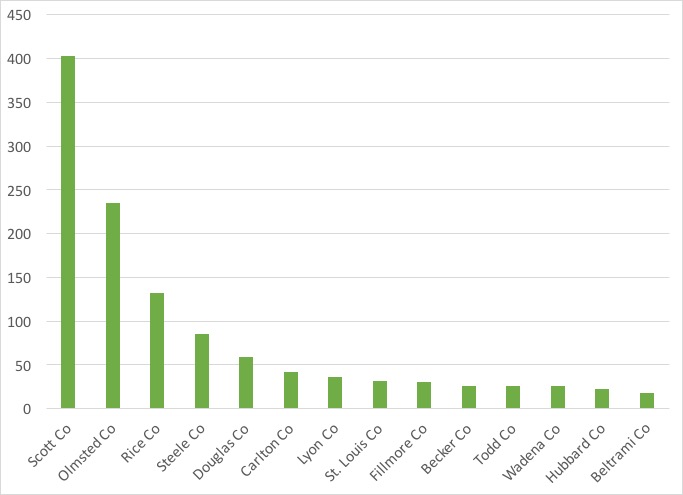
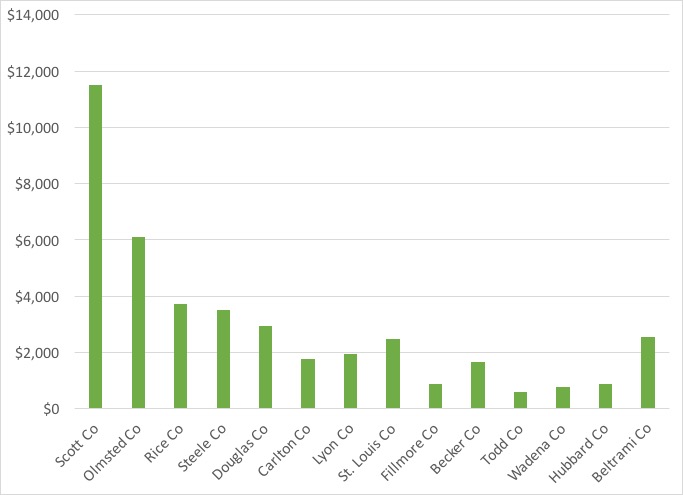
The county with the highest population density, Scott County (403 people per square mile), didn’t collect the most in transportation sales and use tax revenue in 2016. That honor went to St. Louis County, which also has the highest total population in the group. However, if we look at collections per county road lane mile—the amount of sales and use tax revenue divided by county road lane miles—Scott County is by far the winner. For total county road lane miles, Scott County is in fact second from the bottom with only 745 county road lane miles. At the same time, comparing the amount of transportation sales and use tax revenue raised per resident puts Scott County squarely in the middle of the pack at $59.59.
Scott County is, however, compact, with a large population that shops and pays sales taxes within its borders. This large population also uses—and puts a lot of wear and tear on—a relatively small number of county road miles day in and day out compared to other counties in the group.
Steele County, on the other hand, has about the same number of lane miles as Scott, one quarter the total population and collected less than one third the amount of transportation sales and use tax revenue that Scott County did. Todd County has 60% more lane miles than Scott County, less than one fifth the population and collected less than one tenth the revenue per lane mile.
But let’s also consider Beltrami County. It has the lowest population density of any of the counties in the group, at 18 people per square mile. But in terms of revenue collected per county road lane mile, Beltrami seems to defy the pattern (fig. 6b). Beltrami County collected over $2,500 per county road lane mile, a larger figure than half of the more densely populated counties. What happened there?
Bemidji, located in southern Beltrami County, is a retail center, the only sizeable retail center in a 100-mile radius, according to Mack, pulling in shoppers from all over the region, including from outside the county. That gave the county an extra boost. Fig. 6b indicates that St. Louis County (Duluth), Becker (Detroit Lakes), Steele (Owatonna, Medford) and Douglas County (Alexandria) also stand out among the low population-density counties. Their higher collections indicate a comparatively large, isolated economic center, and in the case of St. Louis, Becker and Douglas, a level of tourism and part-time residents.
And those low-density counties that don’t have a large retail center? They showed the lowest collections per lane mile.
In 2015, University of Minnesota Extension’s Center for Community Vitality did a study[6] on the potential of a local option sales tax for Crow Wing County as that county contemplated implementing the tax. Its findings showed that Crow Wing County shared the same characteristics with Beltrami County: a large, geographically isolated retail hub (Brainerd/Baxter) and recreation/part-time residents drawing in shoppers from outside the county.
Extension researchers projected that more than 50% of the revenue from a 0.5% sales tax would come from people from outside of Crow Wing County coming into the county for shopping, dining, and recreation, boosting considerably what county residents could have raised on their own.
These uneven results indicate that a local option sales and use tax can help to supplement transportation funds, but it perhaps shouldn’t be counted on too much as a long-term solution. Rural counties in particular have a large number of highway miles to maintain and a small number of residents to fund their maintenance, but our state’s economy moves on those roads whether in a rural or an urban county. Whether a county has a strong, isolated economic center drawing taxpayers seems to be the measure of success for low-density rural counties where this kind of supplemental funding is concerned, but while every bit helps, a local-option sales and use tax should probably not be depended on as a permanent or significant fix for ongoing transportation funding.
Endnotes:
[1] Center for Rural Policy & Development
[2] MnDOT: State Aid for Local Transportation
[3] Minnesota Statute 297A.993.
[4] Association of Minnesota Counties, mncounties.org
[5] The use tax is a little-known tax that businesses and individuals are supposed to pay on items they have purchased without sales tax. For example, a business purchasing goods for resale does not need to pay sales tax to the seller, but it does then need to pay the use tax to the state. For individuals, this applies mostly when buying items over the Internet from out of state. A person may not pay the sales tax at the time of purchase, but they are expected to pay the use tax later to the state. The use tax rate is the same as the sales tax rate.
[6] Bussiere, Merritt, and Bruce Schwartau, “Local Option Sales Tax Analysis for Crow Wing County,” University of Minnesota Extension, Center for Community Vitality, March 4, 2015. http://www.extension.umn.edu/community/research/reports/docs/2015-Crow-Wing-County-Local-Option-Sales-Tax.pdf