

By Marnie Werner
Vice President of Research
Click for a printable version of this report.
According to a Star Tribune article in January 2022, “For the broader Midwest, inflation was 7.5% in December, far above the 5.9% rate in the more heavily populated northeastern states.” Inflation wasn’t even consistent around the state: “Rochester; St. Cloud; Mankato; Fargo, N.D.; and La Crosse, Wis., reached an inflation rate above 8% through the last months of 2021 …. Duluth was just below that level” (Kumar and Sitaramiah, 2022).
How does it happen that the inflation rate for the Midwest region was at 7.5% in December 2021, but for Minnesota’s population centers, inflation rates were almost two percentage points higher? And was inflation really hitting some parts of the country harder than others?
The short answer is yes. We know that inflation varies over time, but it can also vary in strength in different parts of the country and even within a single state.
In general, inflation happens when, as the saying goes, “too many dollars are chasing too few goods.” We can see how this happened during the pandemic, starting in late 2020/early 2021, where, according to an Iowa State University report, inflation was being driven by three factors:
Pent-up demand. By spring of 2021, people were sitting on money saved up from rising wages, government payments, and not being able to shop, go on vacation, or even drive to work. When they went out into the marketplace to try to buy goods that were often in short supply due to supply chain disruptions, they were effectively bidding up prices.
Supply chain disruptions. Even though things were settling down in the U.S. by 2021, countries around the world were still dealing with sick workers and quarantines, disrupting their ability to manufacture and ship goods. Here in the U.S., a shortage of truck drivers that started before the pandemic was likely exacerbating the supply chain situation (Kumar and Sitaramiah, 2022).
Workforce shortage. Besides truck drivers, workforce shortages that had started well before the pandemic are still disrupting industries and services. Employers have found it challenging to replace retiring Baby Boomers, forcing them to raise wages drastically in a short period of time as they try to attract and retain scarce employees. Those costs have then been passed on to consumers.
Rural areas were hit harder by inflation between 2020 and 2022
As inflation began ramping up, between 2020 and 2022, rural households were hit with a double whammy: a sharp increase in the price of gas for a group that on average drives more miles than urban dwellers. Rural residents in general spend more of their income on gas than urban dwellers, simply because rural drivers travel longer distances for everything and have little to no public transportation as an alternative. Urban households, on the other hand, spend more of their income on housing compared to rural households, said researchers from the Federal Reserve Bank of New York in a January 2023 report (Chakrabarti, et al). While the price of gas went up everywhere in the U.S., the increase in the price from its lowest point right after the start of the pandemic to its peak in June 2022 was sharper for places like the Midwest and the South, which tend to be more rural than the East or West Coasts.
In Minnesota, for example, between 2020 and 2022, the average price of gas (all grades, all formulations; eia.gov) shot up 210%, from a low of $1.55 during the week of May 4, 2020, to a peak of $4.80 during the week of June 13, 2022 (Figure 1). In comparison, California, known for having some of the highest gas prices in the nation, saw only a 132% increase in its average price of gas ($2.72 up to $6.31) during the same time period.
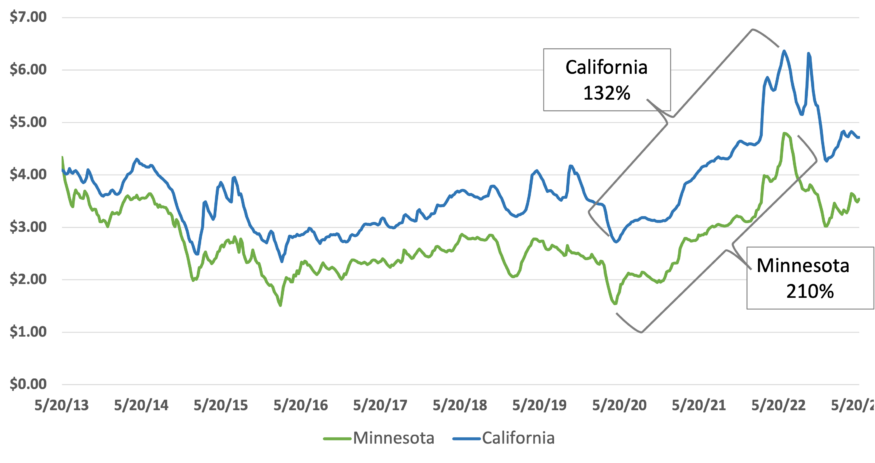
Figure 1: While California’s gas prices tend to be higher, the price of gas rose faster and farther in Minnesota during 2021 and 2022. Data: U.S. Energy Information Administration
In addition, rural households are more likely to own larger vehicles, which get poorer gas mileage, and are more likely to own a used car. Used cars in particular saw a huge increase in used car prices during 2020 due to a lack of new vehicles caused by supply chain problems (Conroy and Weiler).
In cold states in the Midwest, natural gas, liquified petroleum, and propane also jumped in price (Peters, 2022). Even though the price of natural gas fluctuates seasonally (Figure 2), a twelve-month moving average for the price of natural gas in Minnesota from 2013 to 2023 shows the unmistakable trend upward during 2021 and 2022.
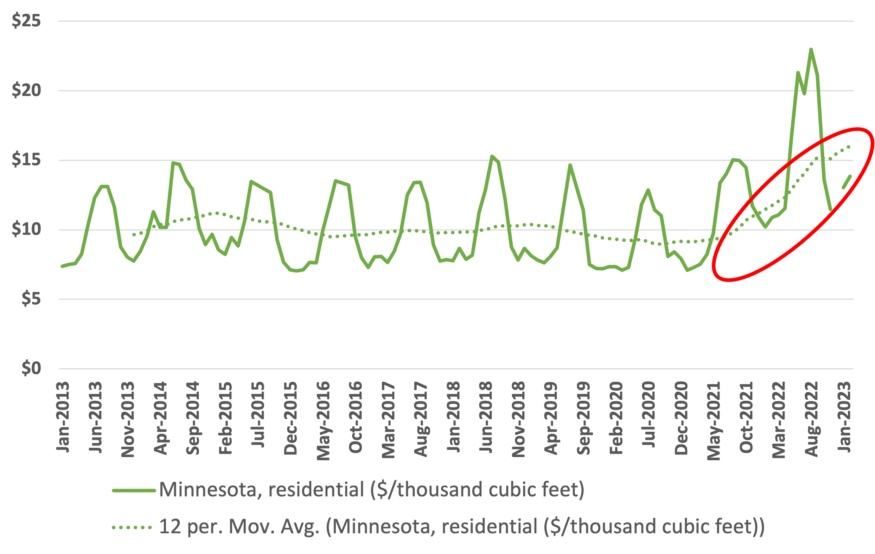
Figure 2: Natural gas prices were staying fairly level or even trending downward until the middle of 2021, when they took a sharp jump. Data: U.S. Energy Information Administration
Although not as serious, inflation in the price of food was also a pain point for rural residents, partly as the cost of shipping products to rural areas drove up prices and partly because, with rural grocery stores dwindling in number, rural Americans also drive farther to get their groceries. The median rural householder has to travel 3.11 miles to shop at their nearest grocery store, compared with 0.69 miles for urban households (Conroy and Weiler), but in the more rural areas, that distance can be much farther.
Inflation affects rural household income differently
These increases in prices also affect rural households’ discretionary income as well, says an Iowa State University Extension report. According to the report, discretionary income (what’s left after necessities are paid for) in rural households is more vulnerable to inflation anyway because rural households have lower incomes on average compared to urban households. This difference is often balanced by the fact that most rural areas also offer a lower cost of living. In 2021 and the first half of 2022, however, rural households were hit much harder by spiking prices for fuel and used cars compared to their urban counterparts (Peters, 2022).
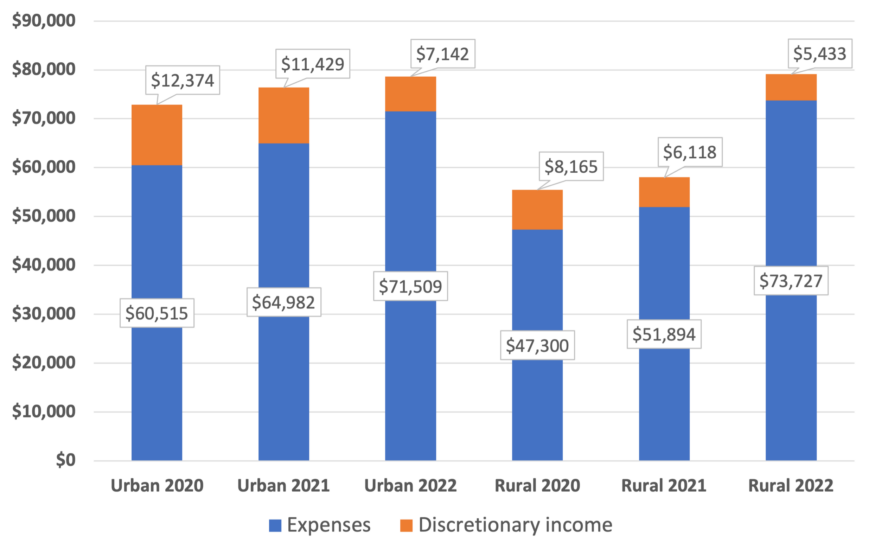
Figure 3: Discretionary income in urban U.S. and rural U.S. households decreased as inflation rose between 2020 and 2022. Only a major jump in earnings saved rural households from losing their discretionary income altogether. Data: Peters, David. “Inflation Impacts on Rural Households in the U.S.” Iowa State University Extension and Outreach, 2023.
Based on an analysis of data from the Bureau of Labor Statistics’ Consumer Expenditure Survey, rural households in 2020 had a median after-tax income of $55,465, of which 85% went to necessities. That left $8,165 in discretionary income for savings and other expenses (Table 1). By 2022, rural earnings had risen by a whopping 43% to a median income of $79,160, but inflation rose faster, by 56%, causing necessities to take up 93% of income that year. Discretionary income shrank to $5,430, two thirds of what it was in 2020.
Table 1: Inflation (the cost of expenses) rose sharply for U.S. rural areas between 2021 and 2022 but were offset by a rise in earnings at the same time.
Data: Peters, David. “Inflation Impacts on Rural Households in the U.S.” Iowa State University Extension and Outreach, 2023.
In urban households, earnings rose by only 8% from 2020 to 2022, while expenses rose 18%, much slower than in rural areas. Because urban households didn’t see the same increase in earnings that rural households did, their discretionary income fell as well, especially during 2022, when transportation costs for rural areas fell and housing costs for urban areas rose (Peters, 2023).
If not for the extraordinary growth in earnings in 2022, however, rural households and their discretionary income would have been far worse off. Rural areas tend to have a higher percentage of households on fixed incomes; these households would not have participated in that earnings growth and therefore would have been much more affected by inflation (Kumar and Sitaramiah). For example, if rural households had averaged only the same 3% increase in income between 2021 and 2022 that urban households had but also saw the same 42% increase in expenses that year, the average rural household would have been nearly $14,000 in the red (Table 2).
Of course, some of the reason behind the big jump in inflation in rural areas in 2022 may have had to do with the large increase in earnings—again, too many dollars chasing too few goods—but this hypothetical scenario is a dramatic illustration of how inflation can eat into discretionary income.
Table 2: If rural U.S. regions had seen only the same increase in earnings as U.S. urban regions had during 2021-2022, the 42% increase in the cost of expenses would have wiped out any discretionary income. This may well have happened in households on fixed incomes that did not see that same increase in income.
Data: Peters, David. “Inflation Impacts on Rural Households in the U.S.” Iowa State University Extension and Outreach, 2023.
Conclusions: We need to dig deeper on inflation numbers
As the economy moved through 2022 and into 2023, gas prices fell while housing costs rose, lessening the burden on rural areas and shifting it to urban areas, especially the Coasts (Chakrabarti, et al).
These kinds of differences between urban and rural households can go unnoticed, however, because the Consumer Price Index for All Urban Consumers (CPI-U), the most common measure of inflation in the U.S., surveys only urban populations, as its name implies. It does capture residents who are technically “rural,” those living in areas that are classified as rural by the Census Bureau. The survey accounts for about two thirds of people living in areas defined as rural by the Census Bureau and represents about 93% of the U.S. population, according to a Congressional Budget Office letter (Swagel).
Rural residents do make up anywhere from 15% to 20% of the U.S. population, depending on which definition of “rural” is used, so the fact that about 15% of households in the CPI survey are rural sounds representative. As the CBO letter goes on to explain, however, those rural survey respondents are located near urban centers. The Bureau of Labor Statistics, which conducts the survey, doesn’t separate out the data on the rural households for separate analysis “nor collects data on prices for people in other rural areas” (Swagel).
As researchers who worked to extrapolate data for the rest of rural America showed, price data in rural areas not near urban centers can be quite different from the prices presented by the CPI. Ultimately, when urban and rural data are combined, urban data usually overwhelm the rural data, disguising what is really going on in more remote areas. So, while the CPI is the standard measure of inflation, in rural areas, it doesn’t necessarily tell the whole story.
References
Abrams, Ben. “Inflation Is Crushing Rural America and May Even Drive People to the Cities.” News. NPR, July 25, 2022.
Callaghan, Peter. “DFL Transportation Deal Includes Tying Gas Tax to Inflation, Adding New 50-Cent Delivery Fee, Metro Sales Tax.” MinnPost, May 20, 2023.
Chakrabarti, Rajashri, Dan Garcia, and Maxim Pinkovskiy. “Rural Households Hit Hardest by Inflation in 2021-22.” Federal Reserve Bank of New York Liberty Street Economics, January 18, 2023.
Conroy, Tessa, and Stephan Weiler. “Rural Americans Aren’t Included in Inflation Figures. For Them, the Cost of Living May Be Rising Faster.” The Daily Yonder, February 8, 2023.
“Consumer Price Index, Midwest Region – January 2023: Mountain–Plains,” Information Office: U.S. Bureau of Labor Statistics, January 2023.
George, Aubrey, and John O’Trakoun. “Small Towns, Big Cities, Shared Inflation.” Federal Reserve Bank of Richmond Macro Minute (blog), April 12, 2022.
Kashkari, Neel. “Policy Has Tightened a Lot. Is It Enough? (An Update)”, Federal Reserve Bank of Minneapolis,” June 17, 2022.
Kaul, Greta, and Walker Orenstein. “Greater Minnesotans May Be Feeling the Squeeze of Inflation More so than Their Metro Counterparts.” MinnPost, June 23, 2023.
Kumar, Kavita, and Gita Sitaramiah. “Inflation Hits Minnesota’s Smaller Cities and Rural Areas Harder than Twin Cities.” Star Tribune, January 29, 2022.
Marketplace. “High Inflation Looks Different, Hits Harder, in Rural America,” September 2, 2022.
“Midwest Consumer Price Index Card.” Midwest Information Office: U.S. Bureau of Labor Statistics, January 2023.
Mitchell, Travis. “1. Demographic and Economic Trends in Urban, Suburban and Rural Communities.” Pew Research Center’s Social & Demographic Trends Project, May 22, 2018.
Montgomery, David H. “How Much Are High Gas Prices Affecting the Upper Midwest?” Federal Reserve Bank of Minneapolis, July 15, 2022.
Peters, David. “Impact of Inflation on Rural Household Expenses in the U.S., June 2020-2022.” Iowa State University Extension and Outreach, July 2022.
Peters, David. “Inflation Impacts on Rural Households in the U.S.” Iowa State University Extension and Outreach, 2023.
Schaffhauser, Anthony. “Are Northwest Minnesota Wages Keeping Up with Inflation?” Minnesota Employment Review (blog), October 2022.
Sindelar, Kristen. “Inflation Broadens Financial Gap between Rural, Urban Communities.” Midwest Messenger, September 23, 2022.
“What You Need to Know about Inflation in Minnesota.” Star Tribune, March 25, 2022.
Swagel, Peter. “CBO Letter on Rural-Urban Inflation Comparison,” January 31, 2022.
Weiler, Stephan, and Tessa Conroy. “Analysis: Cost of Living May Be Rising Faster for Rural Americans.” PBS News Hour (blog), January 29, 2023.
Weiler, Stephan, and Tessa Conroy. “Rural Americans Aren’t Included in Inflation Figures – and for Them, the Cost of Living May Be Rising Faster.” The Conversation, January 27, 2023.