

April 2020
By Kelly Asche, Research Associate & Marnie Werner, VP Research
Note to readers: We were just getting ready to release this report when the COVID-19 pandemic showed up on Minnesota’s doorstep and everything changed. We believe the findings of our report still hold true since they review the past trends, but we have added thoughts on the implications of the COVID-19 pandemic and adjusted our recommendations to reflect the impact the pandemic is already having on Minnesota agriculture.
What is the largest player in Greater Minnesota’s economy? In many people’s minds, it’s agriculture, which has led to a widespread concern that, given the severe downturn in the ag markets over the last few years, the rural economy must be suffering greatly. The economic situation for farmers has been serious for several years now, and policymakers are anxious to help.
The concern for us, though, is how to help. In a world of limited resources, we need to ensure that any help directed to rural areas is sent to the right areas for the right reasons.
We began this project with this research question:
“What are the implications of the current downturn in the agricultural economy for rural communities?”
In answering that question, we found that much of rural Minnesota in fact doesn’t rely directly on the economic fortunes of agriculture anymore. The economy of Greater Minnesota (defined as all of Minnesota except the seven-county Twin Cities region) is overall resilient and diversified. Health care and education are the largest employers.
As with many issues, though, it depends on location. In some regions of the state, agriculture and the services and industries that support it can still have a noticeable impact on the local economy.
To answer our research question, we chose to define “the agricultural economy” as farming and ag-related industries. We then examined the trends in revenue, wages and employment for these two groups and looked for a connection between them and changes in overall revenue, wages and employment in Greater Minnesota.
Farming in trouble
In Minnesota, crop farmers have been in the spotlight recently due to trade conflicts with China, but in reality, all of farming has been in trouble for several years. Along with grain prices that have plummeted from record highs in 2013, rising input costs, uncertain regulations, changing demand overseas, weather-related disasters, and steadily shifting markets for meat and dairy products are all contributing to farmers’ troubles.
Looking at farm revenue (Fig. 1), it’s apparent how much the various issues affecting farming today are affecting farmers in Minnesota. During the farming boom from 2010 to 2013, farm revenue across the state peaked, but then fell off rapidly.
From 2013 to 2018 (the most recent year of data available), cash receipts from marketings, the farm equivalent of gross sales, dropped 20%, and by 2018, cash receipts were $4.5 billion below their peak of $22.3 billion in 2013. (Cash receipts from marketings do not include government payments or non-farm income.) Even with this loss, receipts in 2018 were still well above the $8.2 billion generated in 2001, but the costs of production have been rising steadily as well. In 2015 and 2016, farmers were on average losing money as production expenses exceeded receipts. From 2016 to 2018, prices appeared to stabilize, but farmers were still barely breaking even.
Fig. 1: MN farm income & expenses (cash receipts from marketings) compared to production expenses. Since 2015, cash receipts from marketings is below the cost of production. Data: Bureau of Economic Analysis
Minnesota is a large state, however, and as we know, different industries dominate different regions. To gauge agriculture’s specific impact, we looked to similar work already done by Dr. William Lazarus at the University of Minnesota’s Department of Applied Economics. Dr. Lazarus’s research analyzes the ripple effect that declines in farm spending could have on specific industry sectors in the state. In looking at four areas of spending—farm machinery, buildings, cropland rents, and fertilizer—his analysis found that while the economic hit to the state’s overall economy would be minuscule (less than one half of 1%), the degree of impact would likely vary by community based on each place’s economic composition.
Using Dr. Lazarus’ findings as a starting point, we assembled additional statistics by county, economic development region and planning region that would help us understand how the farm economy is impacting Greater Minnesota’s economy: earnings (wages and salaries), employment (number of workers), and gross sales (revenues). Analyzing these statistics would allow us to identify counties where farming makes up a larger part of the local economy and would be more prone to feeling the impacts of changes in the farm economy.
Farm earnings, as reported by the Bureau of Economic Analysis, give us an insight into how much those directly involved in farming are making and how that compares to earnings in other sectors of the economy. Farm earnings are comprised of the net income of sole proprietors, partners, and hired laborers originating directly from the current production of agricultural commodities. It does not include the income of farm corporations and does not include off-farm income[i].
The growth of farm earnings was nothing short of spectacular during the Great Recession, peaking statewide at nearly 500% above their 2001 level, but the drop-off after 2014 was equally spectacular. By 2018, farm earnings were lower in every single county compared to previous years, and in some areas, farm earnings were back down to the same levels as in the early 2000s.
At the same time, total earnings (wages and salaries) across the state grew at a more modest but much steadier rate.
Fig. 2: Farm earnings, the equivalent of wages, grew nearly 500% between 2001 and 2013, but by 2018, that growth had been all but erased. Data: Bureau of Economic Analysis
Impact: Location matters
Farming’s direct financial impact on Minnesota’s economy overall is relatively small. At the commodity boom’s peak, cash receipts from farming represented about 6% of Minnesota’s gross sales from business, while farm earnings from work on the farm only comprised about 3% of total earnings statewide. So even for Greater Minnesota, the farm crisis does not appear to be having that great of an impact. However, farming is more prevalent in some parts of the state than others.
We broke the state down in three different ways:
- RUCA codes: Rural-Urban Commuting Areas is a system developed by USDA to group counties by demographic similarities instead of just geographic location. Using this system, we can look at earnings based on the “ruralness” or “urbanness” of an area. (Click here for a more extensive definition of RUCA codes.) Not surprisingly, farm earnings grew and declined at the fastest rate in the entirely rural group of counties, which are located mostly along the western and southern sides of the state.
Figure 3: Minnesota’s counties grouped by RUCA codes, farm earnings compared to total earnings, 2001-2018. The total earnings for our more rural county groups have a similar peak and valley to the farm earnings, meaning they are a bit more influenced by the farm economy. Learn more about RUCA county groups here. Data: Bureau of Economic Analysis
- Planning regions: Minnesota is also divided into six federally designated planning regions, allowing us to compare different regions of the state. Breaking earnings down by state planning region, it’s easy to map the concentration of farming (Fig. 4).
Fig. 4: Farm earnings compared to total earnings by planning region, 2001-2018. When earnings are aggregated towards larger regions that contain more larger cities in them, there is less influence on them from farm earnings. Except for slight bumps in the Northwest and Southwest planning regions, the total earnings in other regions didn’t show any similar patterns to farm earnings. Data: Bureau of Economic Analysis
- Economic development region (EDR): The state is also divided into thirteen EDRs. Based on our analysis, we found a handful of economic development regions where total earnings seem to be affected by ups and downs in farm earnings: EDRs 4, West Central; 6W, Upper Minnesota Valley; 8, Southwest; and 9, South Central. And indeed, when we compare the pattern of farm earnings to total earnings, correlations showed up in EDRs 4, 6W and 8 (Fig. 5).
Fig. 5: Farming earnings and total earnings for select EDRS, indexed to 2001. The total earnings in these three EDRs in particular followed similar patterns/trends to farm earnings. They are likely more influenced by the farm economy than other EDRs. Data: Bureau of Economic Analysis
The impact of the downturn in the farm economy on farm employment is less clear. Employment in farming has been dropping off at a rapid rate statewide since at least 2001 with only a little break around 2010-2011 (Fig. 6). In the most rural areas of the state (entirely rural counties), total employment has been dropping for years as well, while in the somewhat less rural counties (town/rural mix group), total employment has been growing, albeit slowly. Rural counties have been losing workers for a few decades, due largely to retirements and out-migration.
Fig. 6: Farm employment by RUCA groups, 2001-2018. Farm employment has been on a slow and steady decline across the state. Learn more about RUCA county groups here. Data: Bureau of Economic Analysis
In farming, a shortage of workers is a very real problem for farm producers despite advancements in technology and automation. All regions of the state have lost farm employment since 2001, but for most regions, it makes up a small enough percentage of total employment that any shifts barely register. We did note employment patterns in some economic development regions, however:
- EDR 1, Northwest, lost 32% of its farm employment between 2001 and 2018. In addition, the region’s overall total number of workers stayed flat.
- In central Minnesota, both EDR 7E, East Central, and EDR 6E, Southwest Central, saw significant declines in the number of farm workers and limited growth in the number of total workers: 6% in EDR 7E and 4% in EDR 6E.
- In the Southwest region, all the EDRs are worth taking a closer look at, but especially 6W, Upper Minnesota Valley, and EDR 8, Southwest, where the total number of workers was at 93% and 99% of 2001 levels, respectively.
Fig 7: Farm employment in select EDRs. The total employment in these EDRs have not grown much, if at all, while farm employment has also decreased significantly. However, it’s difficult to discern how much the decreasing farm employment has on total employment since demographic changes are happening across all industries. Data: Bureau of Economic Analysis
The shrinking pool of workers is, in fact, the number one issue for economic growth in Greater Minnesota right now, according to economic developers. In the Southwest and Northwest planning regions, the number of jobs available in all sectors are at all-time highs due to both the shrinking workforce and economic growth.
Trends in ag-related industries
The other half of the agricultural picture is ag-related industries, those industry sectors that either support farming through supplies or services (the fertilizer or seed dealer, the implement dealer, the veterinarian) or use the direct products of farming to produce another product or a service (for example, food manufacturing)[ii]. These are the sectors that could be expected to feel the most direct impact from the ups and downs in farming. Comparing gross sales of the ag-related sectors to cash receipts from farming and gross sales of all Minnesota businesses shows that this is in fact the case.
Fig. 8: Ag-related industries, farm cash receipts and total gross sales indexed to 2001 levels. Farm cash receipts and gross sales in ag-related industries follow similar patterns with a peak around 2012-2014 followed by significant decreases. Total gross sales has not been impacted by the downturn in the ag-economy. Data: Bureau of Economic Analysis, MN Department of Revenue – Sales and Use Tax, MN DEED – QCEW
Identifying ag-related industries is a bit of a matchmaking game. Industries in general are categorized using the North American Industrial Classification System, otherwise known as NAICS. The NAICS classification system, however, only includes “covered employment,” meaning workers who are covered by unemployment insurance. Therefore, while the NAICS system includes most businesses in the U.S., it does not include one important group: the self-employed, which includes those farmers who are not paying for unemployment insurance.
However, many of the businesses that serve farmers are included in the NAICS system. For this analysis, we identified and collected together those NAICS industry sectors that are directly related to farming but are categorized under other, non-agricultural sectors such as manufacturing; transportation; or agriculture, forestry, fishing and hunting. See the appendix for the full list of sectors we included in this analysis.
Like farming, ag-related industries do not make up a large part of the state’s economy. At the farming boom’s peak in 2013, gross sales from ag-related industry sectors made up only 5% of total gross sales statewide, according to Minnesota Department of Revenue data. But still, in 2018, ag-related industries employed over 81,000 people around the state and paid nearly $4.5 billion in wages.
Unlike farming, where earnings have been falling off a cliff almost everywhere in the state, ag-related wages since 2001 have been growing steadily in many economic development regions. In particular, EDRs 7W Central, 6E Southwest Central, 4 West Central, 5 North Central, and 9 South Central all experienced higher growth in ag-related wages compared to the growth of total wages in their regions. On the other hand, EDR 8 Southwest and EDR 6W Upper MN Valley both experienced declines in their growth in ag-related wages.
Fig. 9: Ag-related wages since 2001 in actual numbers. Data: MN DEED – QCEW
On the employment side, jobs in ag-related industries have been steady or climbing in most of Greater Minnesota, despite the farm crisis. The number of ag-related industry jobs has been growing in particular in the Southeast, Northwest and especially Central Minnesota regions.
Fig. 10: ARI earnings, average wage, etc., by planning region. Data: MN DEED – QCEW
As the wage and employment data shows, while ag-related industries—and farming—contribute a small percentage to most regions of the state, they are more significant in one region, southwestern Minnesota. In the Southwest planning region, which includes 23 counties along and southwest of the Minnesota River, ag-related industries contributed $1 billion, or 14% of the region’s total wages, and 11% of total jobs in 2018. The average annual ag-related industry wage paid $10,000 more than the average wage overall in the Southwest region as well, $52,000 vs. $42,000. Between 2001 and 2018, employment in ag-related industries dropped while total employment in the Southwest planning region grew, albeit very slowly, about 5% between 2001 and 2018.
Shouldering the burden
While ag-related industries and total wages and employment appear to be largely unaffected by the current farm crisis, that may be because farmers are shouldering the debt loads that make it possible for them to continue buying inputs and paying for the services they need to produce even as they face a net loss in income.
The strain on ag-related businesses may also be hiding in the top line of cooperatives. As many as 75% of ag-related businesses in rural Minnesota on both the input and marketing sides are cooperatives, member-owned businesses that return profits to their members, who are also their customers, in the form of annual dividends. Coops can maintain revenue levels because regardless of the economy, farmers must still purchase inputs and sell their products, and coops maintain a certain amount of cushion. When farmers cut back on spending, however, there are no profits and therefore no dividends. In 2019, a growing number of cooperatives did not pay out dividends to their members, another instance where member farmers are absorbing the impact of the poor farming economy.
Red flags in a quickly changing future
Agriculture is and always will be a business very much at the mercy of the uncontrollable: weather, trade relations, changing consumer tastes and now surprise pandemics are all piling onto the difficulties that have been growing the last several years. We had flagged a number of issues to keep an eye on going into the future, but the rise of the COVID-19 pandemic has introduced some more.
• The ethanol industry
Between the COVID-19 pandemic and the Saudi-Russian oil war, the price of oil has been pushed down close to $20 a barrel as of early April, a grim double “black swan” event for Minnesota’s ethanol industry and for the state’s corn farmers.
About 40% of Minnesota’s corn goes into making ethanol, and demand for ethanol is closely tied to the price of and demand for gas.
Ethanol is used mostly as an additive to unleaded gasoline as a means of reducing pollution. Ethanol and gas sell at different prices on the wholesale market, however. As long as the wholesale price of ethanol is lower than the wholesale price of gas, adding ethanol to the gas (blending) not only works to reduce air pollution, it lowers the overall price of a gallon of fuel by making the gas go farther, so to speak.
In a time of low oil prices, however, if the wholesale price of gas drops below the wholesale price of ethanol, there is no incentive to add the ethanol. It will only make the price of a gallon of fuel higher.
Right now (early April 2020), the price of oil is down about 60% from the beginning of the year, when the price was $60 a barrel, according to the U.S. Energy Information Administration. That in turn has forced ethanol prices down about 40%. To maintain any kind of profitability, ethanol producers have had to cut their expenses, which means forcing down the selling price of corn. For both growers and ethanol producers, going any lower would mean selling their product below the cost of producing it. For that reason, ethanol plants in Minnesota have been shuttering over the last couple weeks.
Ethanol plants are one of the ag-related industries that have a larger impact locally. They are located mostly in western and southern Minnesota, in those economic development regions discussed earlier: EDR 4, West Central; 6W, Upper Minnesota Valley; 8, Southwestern; and 9, South Central. In these regions, ethanol plants are a large contributor to their local communities in terms of employment and wages, property taxes, and local business.
For farmers specifically, however, the loss of the ethanol market is a huge blow. Last year, corn growers were struggling to find ethanol markets to sell to due to the issue of federal Renewable Fuels Standards waivers many refineries were receiving. With the ethanol market off the table again, excess corn has no place to go and the price of corn will continue to sink, affecting not just farmers, but the many cooperatives and businesses that rely on them and the ethanol producers.
For livestock producers, ethanol plants are also the source of dried distillers grains (DDGs), an important and relatively inexpensive source of feed for cattle and hogs. Losing access to DDGs will mean turning to more expensive feed sources to meet the protein needs of livestock, again affecting profitability in livestock production.
Farmers are making decisions about what to plant this spring right now, and for those who had been planning on corn, they must now decide whether to go ahead with it. There is the option of switching to soybeans, which would mean trying to get money back that has already been spent on seed, fertilizer and other inputs for corn. Soybeans also require different growing conditions, so not every field that grew corn is suitable for soybeans. And there is always the option of not planting at all. None of these options are appealing to farmers right now.
• Worsening debt levels
How long can farmers hold on making little to no profit? A look at the trend in the debt situation for the average Minnesota farmer shows a deteriorating situation. Debt and credit play a large role in farmers’ ability to stay afloat. Crop farmers are essentially paid once a year, while livestock farmers may make money more often but still sporadically.
Their expenses, meanwhile, including the inputs and equipment they need to raise their crops and livestock, must still be paid throughout the year. Therefore, the health of a farmer’s debt situation is an important indicator of overall sustainability.
Farms by nature are asset rich. Equipment, outbuildings, the house, unsold product, livestock, are all assets that can be sold to cover debt when income isn’t coming in. The issue is when the assets no longer cover the debts, either because assets have shrunk too much or debts have grown too much. A higher ratio of debt to assets indicates higher financial risk; bankers become more reluctant to lend to farmers who may end up bankrupt and unable to pay back their loans.
Figure 11: The debt-to-asset ratio is higher than in the early 2000s but still well below the average of 19% during the farm crisis in the 1980s. Data: USDA ERS
Between 2014 and 2018, Minnesota farmers’ debts averaged 13% of assets, which is higher than the 10% debt-to-asset average during the farming boom in 2013, but it is also lower than the U.S. average of 19% during the 1980s.
Another measure of financial stability is the Current Ratio, which shows a borrower’s ability to cover liabilities with assets on hand.
Figure 12: The Current Ratio specifically measures the extent to which current farm assets would pay a business’ or farms’ current liabilities (loans, accounts payable, etc.…) through the sales of its current assets. This measurement shows considerable decline since 2012, meaning farmers are burning through their assets to pay current obligations. Data: USDA ERS
In 2012, the average Current Ratio for Minnesota farms stood at 3.7, or $3.70 in assets for every $1.00 of liabilities, but by 2018, it was averaging 1.7, a considerable drop. This decline indicates that while farmers have had very low or zero income coming in from farming, they have probably been burning through their assets, selling off equipment, livestock or even land to maintain payments on their debts. If banks begin pulling back on lending, farmers will pull back on spending even more than they have already, and the impact will fall the most heavily on those counties most tied to agriculture.
According to Kent Thiesse, long-time ag lender with MinnStar Bank in Lake Crystal, “Market facilitation payments (in 2019) made a big difference by raising incomes. The situation would be a lot more dire without them.” Something to keep in mind, though, Thiesse says, is that U.S. agriculture had lower-than-usual output in 2019. If production goes back up to normal levels in 2020, “we will have a larger number of bushels to find a home for.”
• Closed schools and the long-term trends for dairy
Before the pandemic, ongoing research by University of Minnesota Extension was already finding that troubles in the livestock sector may have a larger impact at the local level than low grain prices would.
The dairy industry was already in the midst of a tectonic shift in market trends, with demand for fluid milk down by as much as 25% over the last two decades as consumers switch to non-dairy alternatives.
With the closing of schools in an effort to control the spread of COVID-19, however, the dairy industry has lost a major market for fluid milk: school-age children. Schools have stopped ordering milk and will likely not do so again until next fall. Milk, of course, can’t be stored up to be used later, so in less than a month, an industry that was already on the edge has been pushed even closer to it.
Extension’s research found that livestock operations tend to be more connected to services and businesses in the local economy compared to grain farming. Worry was growing among local leaders as to what impact ongoing bankruptcies among livestock farmers, especially dairy farms, might have on their communities.
Even a reduction in the number of animals has an impact. In Stearns County, for example, the number of dairy cattle has dropped by 5,000 head since 2013. Extension researchers are estimating that that decline was already going to have significant indirect impacts on the local economy, particularly in industry sectors such as wholesale trade, food manufacturing, and support activities such as veterinary services (Fig. x).
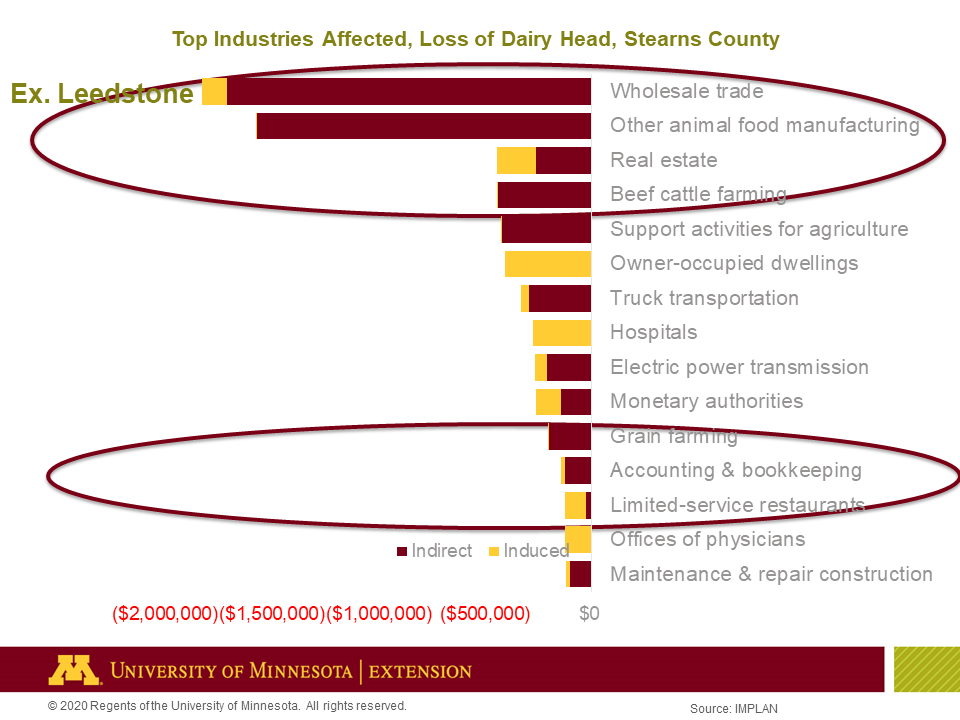
Fig 13: A slide from a recent presentation given by the University of Minnesota Extension highlights the significant indirect impacts the loss of dairy head can have on industries across Stearns County. Source: University of Minnesota Extension
Just as worrisome, however, is the amount of outstanding debt from farmers these local businesses are holding, waiting for payment. With every bankruptcy, these unpaid debts are wiped off the books, with potentially serious ramifications for the businesses they’re owed to.
• COVID-19 and demand for food
Right now, food producers are on a roller-coaster ride concerning their markets. With food service essentially shut-down, demand for food products has shifted to households. Research shows that households are typically more frugal in their food purchases (less waste than food service industry), and so it’s expected that demand for food will decrease. At the moment, however, it’s uncertain how much demand will decrease, since markets are currently responding to the behaviors of panicked shoppers.
Over the last month, price for boxed beef cut-outs increased 25%, driven by the rush to purchase groceries as the pandemic began impacting households. Beef purchases were largely lower-priced items (rounds, ground beef, roasts) since many households were stocking their freezers in preparation for a long battle with the pandemic.
Interestingly, these higher prices haven’t shown up yet in grocery store prices or trickled down to cattle ranchers. Retailers typically place orders for their product a month or two ahead of time, so the prices in grocery stores today reflect the prices retailers paid a few months ago. Prices for beef are expected to increase in stores in the coming month.
The lack of cash trickling down to cattle ranchers is a bit more challenging to explain. America is producing more beef today than ever before, so essentially, supply is greater than demand. This over-supply of beef gives food manufacturers leverage to keep prices low. Our research above shows this playing out in the ag economy as a whole. Even though farms themselves are seeing significant declines in their revenue, food manufacturing continues to see increases in sales.
It’s difficult to know how farms will respond over the next few months, but one logical result could be that ranchers and other producers cut back on supply, which could which could potentially bring some balance back to the market.
• Land values
Despite the major downturn in farm earnings, land prices continue to stay stubbornly high. Land prices increased quickly during the commodity boom, but they haven’t experienced a corresponding drop yet, although in the more rural counties, that may be changing (Fig. 14).
Fig 14: Land values for agricultural land increased significantly along with net incomes for farm. However, the declines in net farm income after 2012 were not experienced by land values. Learn more about RUCA county groups here. Data: Bureau of Economic Analysis, University of Minnesota – Minnesota Land Economics
Prices are staying up because demand for farmland remains high while those holding the land are slower to sell. Who’s behind the demand varies by location, however. In the more rural counties, many farmers are following an economies-of-scale strategy to survive: bigger is better. Land going up for sale, whether to cover debt or because of bankruptcy, gets bought up by other farmers to increase their holdings and production. In urban counties, the demand is likely coming from developers.
High land prices can be both good and bad for farmers. The stiff competition helps farmers who may need to sell some acres quickly to pay debt and stave off bankruptcy. On the other hand, high land prices on top of the high startup costs already associated with farming make it nearly impossible for new or emerging farmers to enter the market.
Anecdotal stories from farmers and other ag experts indicate that some landowners have been keeping rent prices down to help their renters get by during this downturn. In a sense, they’re buffering their renters from the low grain prices. It’s uncertain, though, how long these landowners will be able to continue this practice, especially given that higher land values equal higher property taxes regardless of their renters’ incomes. Increasing rents could then have serious consequences for struggling farmers.
There is also concern about what could happen to local property tax revenues, especially in rural school districts, if land prices were to decline significantly. School district bonding proposals are presented to voters based on an estimation of how much property tax revenue will come from which pot: ag land, homesteaded property, business property, etc. Because property taxes are based on the tax rate and land value, if the value of ag land in a district suddenly drops by half, for example, the property tax revenue based on the ag land also drops. The rest of the liability for the bonds, which must be paid, then falls on home and business owners. Therefore, for districts made up of a large percentage of farmland, a drop in the value of that land would be of great concern.
Greater Minnesota’s economy going forward
Rightly or wrongly, the narrative around rural Minnesota’s economy is strongly associated with agriculture, but our analysis found that agriculture and ag-related industries, including Minnesota’s seemingly mammoth food manufacturing industry, make up only a small part of Greater Minnesota’s economy as a whole (6.5% of total wages and 6% of jobs in 2018). Greater Minnesota’s economy overall is otherwise healthy and diversified, with health care, education and manufacturing as the top employers.
That being said, however, it is still more fragile than the Twin Cities’ urban economy. At the beginning of 2020, the biggest issue for Greater Minnesota was the workforce shortage, aggravated by a lack of childcare and housing. Four months later, we are looking at the fallout from COVID-19 and how the very necessary strategies needed to slow the spread of the virus are also stressing rural Minnesota’s top employers: education, manufacturing, and especially health care.
But even though farming itself does not appear to play a large part in the state’s economy overall, it does. For the most part, farmers shoulder an inordinate amount of the financial burden and risk involved in producing the food we eat while at the same time supporting and making possible industries that employ tens of thousands of workers and generate billions of dollars in wages and salaries each year.
With that in mind, we offer two recommendations:
- Agriculture does not equal Greater Minnesota’s economy. Understanding the difference between farming and the rest of Greater Minnesota’s economy will help ensure that one interest does not eclipse the other and that the appropriate assistance goes to where it is needed. In farming, it is keeping farmers whole and helping them weather the current situation. In the rest of Greater Minnesota, it is finding solutions for the workforce, childcare and housing shortages. In light of the pandemic, the first order of business will be getting both sectors of the economy back on their feet.
- Connect farmers to options. Given the current upheaval, it’s likely that bankruptcy among farmers will continue into the foreseeable future. With the number of good jobs available in rural Minnesota, going forward, positive strategies that connect people to employment should include displaced farmers. Because they haven’t been part of the “regular” workforce, farmers may be unaware of the extent of options available to them if they decide to leave farming or scale back. This perceived lack of options could be contributing to feelings of failure, hopelessness and despair, making the decision to give up the farm all the more traumatic. We strongly recommend that workforce programs in the agricultural regions of Greater Minnesota review their strategies or create new ones that connect with farmers and show them they have choices.
Despite all the hardships and uncertainties laid out in this report, agriculture is not going anywhere. As long as people need to eat, we will need farmers, and as long as farming requires land, agriculture will be an important part of rural Minnesota’s economy and culture.
Notes:
[i] Definition of farm earnings by the Bureau of Economic Analysis: Farm labor and proprietors’ income is comprised of the net income of sole proprietors, partners, and hired laborers arising directly from the current production of agricultural commodities, either livestock or crops. It includes net farm proprietors’ income and the wages and salaries, pay-in-kind, and other labor income of hired farm laborers; but specifically excludes the income of farm corporations.