
When taking population into account, the rate of COVID-19 cases is just as high, if not higher, in counties outside of the seven-county metro.
By Kelly Asche
May, 2020
Counties outside of the seven-county metro have some of the highest COVID-19 case rates in the state. But this so far hasn’t translated into a similarly high rate of deaths compared to metropolitan areas of the state, and this is likely due to the difference in populations that are being infected across the state.
As with any analysis, it’s important to put numbers into context (i.e. population) when comparing rural and metropolitan areas. One look at the county map of Minnesota highlighting the number of confirmed COVID-19 patients and one would think that outside a few rural counties, this pandemic is largely a metropolitan problem. But converting the numbers to a rate paints a very different picture.
As of May 17, Hennepin County had 5,158 confirmed cases, followed by Stearns with 1,713, Ramsey with 1,530, Nobles with 1,361, and then Anoka, Dakota and Olmsted. In fact, 8 of the top 10 counties with the highest number of cases are considered “entirely urban” counties.
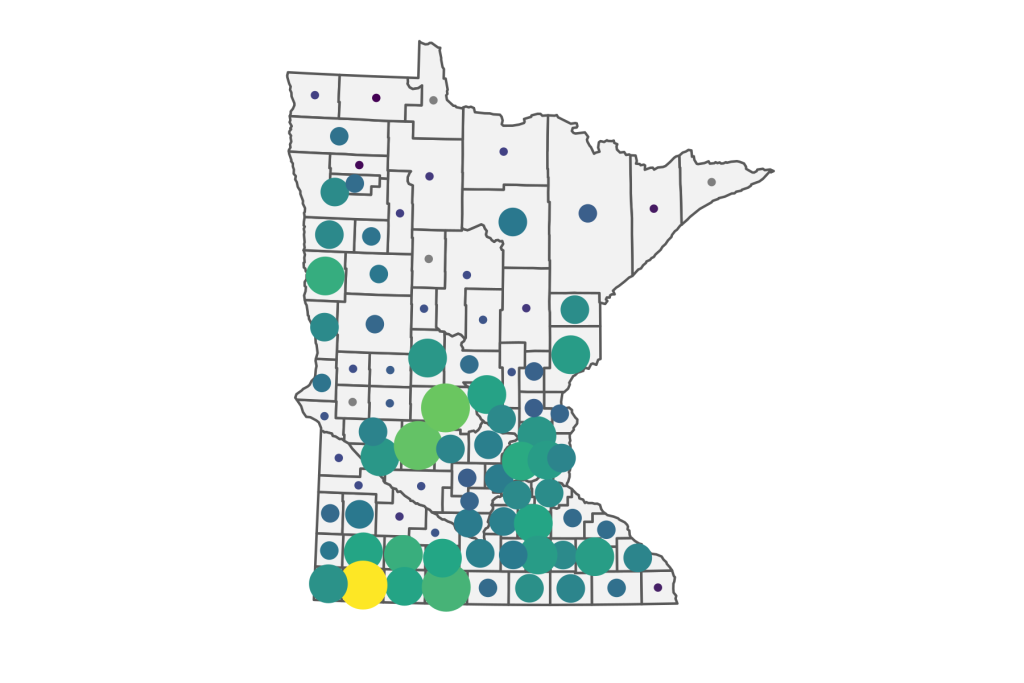
However, so we can make an accurate comparison between the densely populated urban counties (apples) and the more sparsely populated rural counties (oranges), it’s better to look at the rate of confirmations. Figure 1 provides the number of confirmed COVID-19 cases per 100,000 population. What becomes readily apparent is the number of counties outside of the Twin Cities seven-county metro that have as high, if not higher, a rate of COVID-19. In fact, the top ten counties with the highest rate of COVID-19 cases per 100,000 are Nobles, Stearns, Kandiyohi, Martin, Cottonwood, Clay, Hennepin, Watonwan, Murray and Rice. Reviewing the data this way shows that only two counties of the top 10 highest rates are considered “entirely urban” and only one county is located in the seven-county metro.
Figure 1: When comparing the rate of confirmed COVID-19 cases per 100,000 population, many counties outside of the seven-county metro stand out. Data: MN Department of Health
The map above also highlights the division in the outbreak of COVID-19 between Northern and Southern Minnesota. You could literally draw a line across the middle of the state, west-to-east, and see exactly where COVID-19 is having the largest outbreak. Figure 2 provides the cases per 100,000 population by planning region in Minnesota. The two regions with the highest rate are Central and Southwest. Both the Northwest and Northeast planning regions have the lowest rate in the state.
Figure 2: The rate of confirmed COVID-19 cases per 100,000 by planning region highlights the seriousness of this pandemic in southern Minnesota vs. Northern Minnesota. Data: MN Department of Health
Of course, the reason why social distancing and other serious measures have been implemented in Minnesota is to slow the spread of the disease to hopefully reduce the number of deaths. So, lets looks at the death rate across the state. Interestingly, the death rate is painting a different picture than the COVID-19 case rate. Whereas the map showing the number of cases per 100,000 identified Southwest Minnesota as having a significant number of cases, Figure 3 shows that that hasn’t translated into deaths (yet). The highest death rates are so far concentrated in and around the seven-county metro.
Figure 3: The death rate due to COVID-19 highlights the seriousness of the issue in the seven-county metro and other metro locations across the state. Data: MN Department of Health
Why the disparity between the rate of confirmed cases and deaths? As research has shown, older populations and folks with health issues are most vulnerable to having serious complications from COVID-19. So far, in the seven-county metro and a few other counties scattered across Minnesota, a majority of deaths has been in nursing homes and other institutional facilities that are home to people who are either elderly or have health-related issues or both. In much of rural Minnesota, the COVID-19 cases have been largely confined to large employers such as food processing plants and manufacturing. It’s likely that this population is younger, healthier, and less vulnerable to having serious complications from COVID-19.
However, this doesn’t make it any less serious. As these maps show, once it arrives in a county, it can explode and begin sweeping across various populations. Employees who have it can bring it to their homes, their families, their friends, and it’s very likely it will get to the most vulnerable populations.
In addition, tourism season is upon us, and that means people will feel the need to travel. Counties in northern Minnesota have so far had limited numbers of cases, but now the front-line workers in the hospitality industry who deal directly with customers and visitors are in danger of being exposed to the disease and becoming the vectors who carry it to their close friends and families. And with retail and the rest of the economy beginning to open up, it’s incredibly important that we continue to follow social distancing guidelines, and why state leaders need to continue to be aggressive in testing and tracing in the coming months, especially in rural areas. It might look like much of rural Minnesota has been spared, but we’ve already seen what can happen when we’re not diligent. Pandemics can take two years to clear out, not two months, and there are still a lot of unknowns, but if we hang in there and pay attention, we can all come out the other side together.