

by Marnie Werner, VP Research & Operations
Between 2000 and 2015, the price of farmland went on a tear. Prices climbed to levels unseen before, making people nervous. Now, after a respite between 2015 and 2020 where prices stayed fairly level, the farmland market is heating up again. These record prices have implications not just for those who are buying the land, though, but also for local governments in the parts of Minnesota that depend the most on ag land for property tax revenue, namely the far western, southwestern and southern counties.
In some counties, farmland now accounts for more than 75% of the tax base, according to MN Dept. of Revenue data. A local government’s tax base is the amount of property tax revenue the properties in that entity’s jurisdiction can generate after various exclusions and deductions have been applied but before state property taxes and local referendum property taxes have been added in. As a general rule, property taxes make up about 40%–50% of a county government’s annual revenue. Other entities that depend on property taxes include cities, townships, and school districts, plus other smaller entities like soil and water boards and economic development regions.
That high percentage of property taxes coming from one type of land is increasing concerns that these regions’ local tax bases are undiversified. What does it mean to have a diversified tax base? Diversification is a good thing: in terms of revenue sources, it means a government has more than one source—preferably several strong sources—so that if something happens to one, the others can fill in. An undiversified tax base is comparable to putting all your eggs in one basket—if something happens to interrupt the primary revenue source—in this case, the value of farmland—the other sources may not be able to fill the gap.
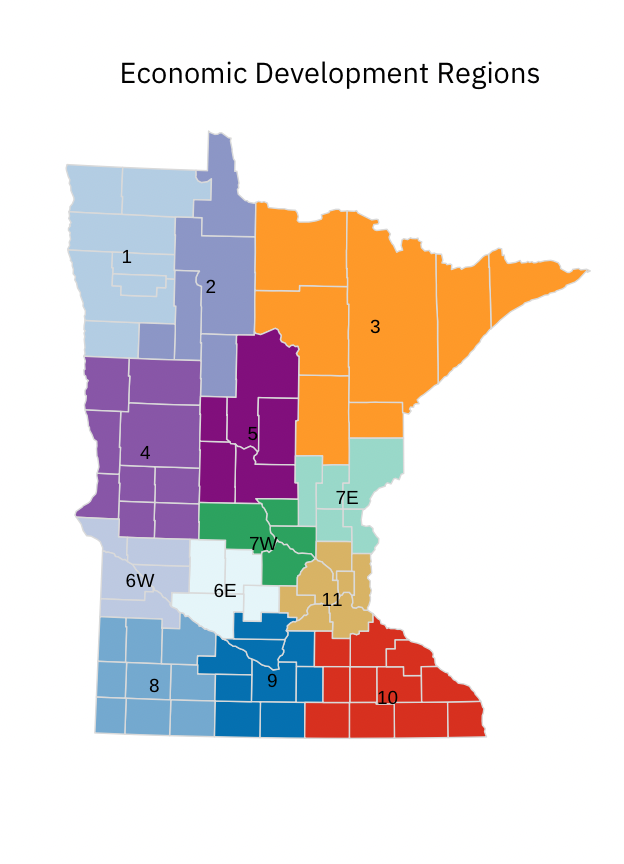
In looking at every region of the state, we found that each one has its own mix of property types, and which property type dominates has a lot to do with location. Let’s compare the tax bases in three regions. There are lots of ways to divide up the state. For this project we compared individual economic development regions, or EDRs, each region containing five to ten counties. What we found was that tax bases can vary quite a bit from one region to the next, even within a region, from county to county.
 For the purposes of assessing property tax, property is divided into several different categories, or classifications, based on how the property is being used. Since there are 15 classifications overall, we grouped them into five larger categories: residential, agricultural, cabins (seasonal recreational property), commercial/industrial, and “other” (including apartments, utilities, railroads, personal property and other miscellaneous types).
When we started comparing economic development regions, we saw fairly quickly that which property types dominate tax bases in different parts of the state makes a lot of sense.
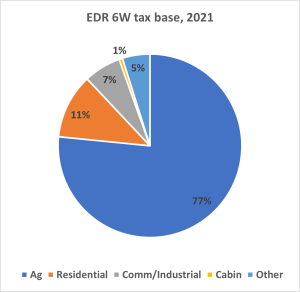
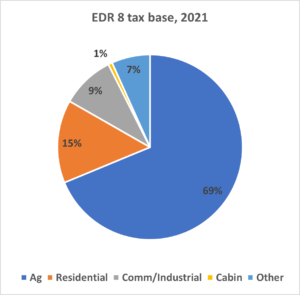
For example, EDR 6W and EDR 8 in the southwest corner of the state take in some of Minnesota’s most productive farmland. In 2021, farmland made up 69% of EDR 8’s tax base, and 77% of EDR 6W’s. That’s a lot of the tax base in one basket.
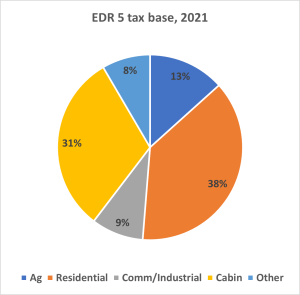
Other EDRs are more diversified, not because they’re doing anything better but because where they’re located, the land is being used for different purposes. For instance, EDR 5 is located in the lakes region of north central Minnesota and its tax base reflects that: it’s dominated by residential properties (38%) and cabins (31%) with also a healthy amount of agricultural property (13%) thrown in.
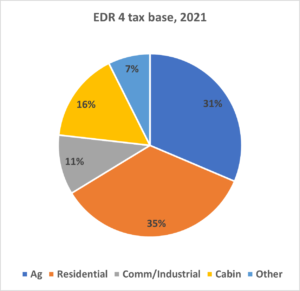
Likewise, in EDR 4, the tax base is divided evenly between agriculture and residential property (31% and 35% respectively), with the other one third divided among commercial/industrial, cabins, and other.
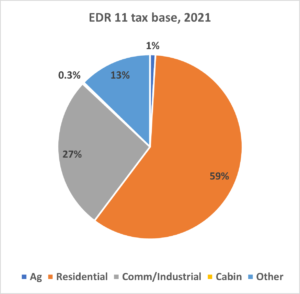
Compared to EDRs 4 and 5, 6W and 8 look pretty undiversified, but so does one other region: EDR 11, the seven-county Twin Cities region. Here, residential property made up 59% of the region’s tax base in 2021, while commercial/industrial represented another 27% and “other,” another 13%.
While reliance on one property type for the local tax base is not inherently bad, it adds risk. When the Great Recession hit in 2009 causing home prices to plummet nationwide, EDR 11’s residential tax base contracted, going from a peak of $2.5 billion in net tax capacity to $1.85 billion in 2014, a drop of 24%, before moving up again in the recovery. In 2009, residential net tax capacity made up 66% of the total EDR 11 tax base, and it had a definite effect: the entire tax base contracted by 18% in those five years.
During that time, though, regions like EDR 6W and EDR 8 saw little effect. While the market for housing contracted, the agricultural economy, and therefore the market for ag land, barely even paused.
But what would happen if the market for ag land crashed?
During the farm crisis of the 1980s, property tax delinquencies nationwide increased nearly 400 percent between 1980 and 1985, causing major disruptions in the rural economy[1] and teaching us all to be wary of too much of a good thing.
Thankfully, 2022 is not 1980, but tax base diversification remains an important trend to pay attention to. In our upcoming report, “Stratosphere: Farmland and its growing importance in rural tax bases,” we explore the relationship between ag land values and rural property tax revenue and consider just how concerned local governments should be about the trend. As agricultural land values continue to rise, it is important for policymakers to consider the impact that dependence on that one property type may have.
Check back with us in a couple weeks to read the full report.
[1] https://www.minnpost.com/mnopedia/2019/05/during-the-1980s-farm-crisis-minnesota-lost-more-than-10000-farms/