
January 16, 2024
By Kelly Asche, Senior Researcher
Every December the U.S. Census Bureau releases the new American Community Survey data, representing the previous year. And with that release the Center for Rural Policy can update all the numbers representing rural Minnesota and release the annual “State of Rural” report.
The big takeaway again in this year’s report is the extraordinary shift in migration patterns that started in 2020 and continues into 2022: migration into Greater Minnesota and migration out of the urban areas.
In our previous blog post we explored that trend by grouping counties into the Minnesota State Demographer’s Rural-Urban Community Area categories. Of course, when the state’s 87 counties are grouped together into four categories, a lot of nuance is lost. When we explore migration numbers at the county level, we see that for even those counties that continue to experience out-migration, the severity is significantly less.
Figure 1 highlights which counties experienced annual in-migration (blue) vs. annual out-migration (red) from 2020 to 2022, as well as which counties have shown opposite migration trends compared to last decade. A quick glance highlights many counties in northern Minnesota and southeastern Minnesota that were experiencing out-migration last decade but are so far experiencing in-migration. However, counties in Southwest and along the very western edge of the state are still experiencing out-migration. In fact, the number of counties experiencing an annual in-migration from 2010 to 2019 was 34 counties. In 2020 to 2022, that number has grown to 47 counties.
Figure 1: The number of counties in Greater Minnesota experiencing in-migration has grown significantly, especially in Northern and Southeastern Minnesota. Data: US Census Bureau – Annual Population Estimates
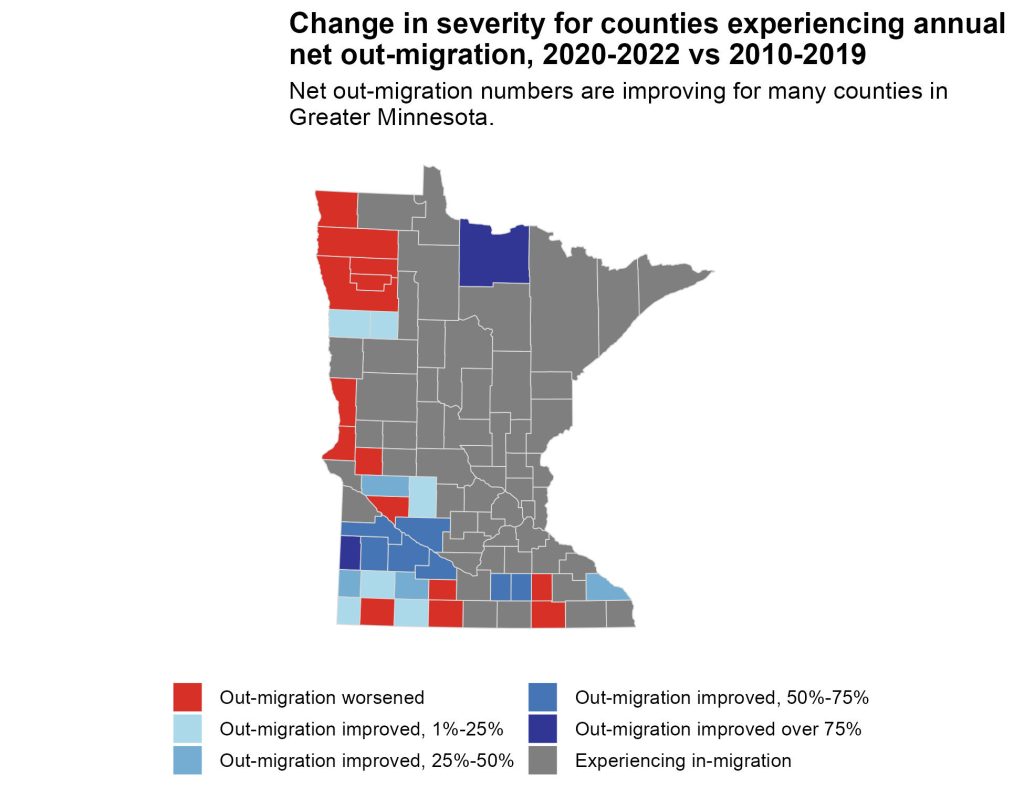
Even for counties that experienced net out-migration both last decade and this decade, however, the rate of people leaving isn’t as severe. Of the 33 counties that experienced a net out-migration over both decades, 19 of those have a net out-migration significantly less than the previous decade (Figure 2). Many of these counties are located in Southwest corner of Minnesota.
Figure 2: Many counties that are continuing to experience net out-migration are seeing the severity of the exodus lessen. Data: US Census Bureau – Annual Population Estimates
The migration patterns are very different so far in 2021 and 2022 compared to the previous decade, even for those counties that are still experiencing a net out-migration. We still don’t know if and how significant this shift will last into the coming years. The next few years will be interesting to watch and see if these shifts stick.