by Ben Winchester, University of Minnesota, Extension Center for Community Vitality
Introduction
The uncertainty of where individual wealth will end up as baby boomers pass their assets on to the next generation has raised alarms about the future of our small towns. In past articles for the Center, I’ve attempted to show another, positive side to rural Minnesota to counteract all the negative news out there.[i] For this article, I want to look at wealth in a broader way, at the community rather than individual level. Looking at wealth this way shows that rural areas have built up some significant sources of wealth in recent decades, just not the kind we’re used to.
Typical Constructs of Wealth
The topic of wealth is becoming increasingly important today as the largest generation in our history to retire begins its path toward old age. Historically, considerable attention has been paid to the accumulation and transfer of financial assets from one generation to the next. These assets are described in purely economic terms and are measured at the individual level[ii]. Over the next 20 years, they’re expected to amount to more than $47.9 billion in Minnesota alone[iii].
In rural communities, where a greater percentage of the population is older, this immense transfer has the potential to have a significant negative impact if, following the death of local residents, financial assets are transferred to family members living elsewhere. Many philanthropic and community foundations, in fact, have begun helping communities capture and retain this generational wealth in the region by providing vehicles to establish community funds. The goal of this article, however, isn’t to detail strategies and impacts at the individual-wealth level. Instead, let’s look at a framework—and examples—that describe wealth more broadly, at the community level.[iv],[v]
The Community Capitals Framework
The Community Capitals Framework (CCF) is a means of examining community wealth, allowing us to see multiple types of wealth, many of which are not tied to specific individuals.
All of these types of capital can be accumulated or depleted as a result of investment and consumption decisions and can contribute to the well-being of people. These characteristics make this broad set of assets important for economic and community development, even if not all of these are marketable or easily measured.[vi]
The CCF was developed in 2006 by Cornelia and Jan Flora[vii] to examine how successful communities operate. The individual “capitals” are defined as “natural, human, social, and built capital from which a community receives benefits and on which the community relies for continued existence.”[viii] There are seven capitals identified in this framework:
- Natural capital: Those assets that abide in a location, including resources, amenities and natural beauty.
- Cultural capital: Reflects the way people “know the world” and how to act within it. Cultural capital might include ethnic festivals, multi-lingual populations or a strong work ethic.
- Human capital: The skills and abilities of people, as well as the ability to access outside resources and bodies of knowledge in order to increase understanding and to identify promising practices. Human capital also addresses leadership’s ability to lead across differences, to focus on assets, to be inclusive and participatory, and to be proactive in shaping the future of the community or group.
- Social capital: Reflects the connections among people and organizations or the social glue to make things happen.
- Political capital: The ability to influence standards, rules, and regulations and their enforcement. It reflects access to power and power brokers, such as access to a local office of a member of Congress, access to local, county, state, or tribal government officials, or leverage with a regional company.
- Financial capital: The financial resources available to invest in community capacity building, to underwrite business development, to support civic and social entrepreneurship, and to accumulate wealth for future community development.
- Built capital: The infrastructure that supports the community, such as telecommunications, industrial parks, main streets, water and sewer systems, roads, etc.
Considering Minnesota’s Rural Capitals
In Minnesota, we’re blessed with a diverse landscape, from pines and lakes to prairies and rolling bluffs, that contributes to a diversity of natural capital. From the cultural perspective, rural areas are home (and quickly becoming new homes) to a rich ancestral, racial, and ethnic population that overall expresses a global diversity at a local level. We also have a rich civic life, reflected not only in some of the highest voting rates in the nation, but also in the creation of vehicles that bring about social change.
While the population of rural Minnesota increased from 1970 to 2010 by 11%, the percentage of Minnesotans living in rural areas declined from 34% to 27% today, due to the much higher growth rate found in urban areas. At the same time, some formerly rural places have become quite urbanized, including counties like Blue Earth, Carlton, Isanti, Mille Lacs, and Sibley. This shift in weight from rural to urban negatively impacts rural’s political presence as core urban and suburban populations gain greater representation, not just in Minnesota, but in the nation as a whole.
In general, the more diversified a rural economy becomes, the less likely it is to see dramatic declines in wealth outflows if and when a single industry experiences a downturn. Communities with diverse economies hedge their bets by supporting both industrial development and entrepreneurs to improve agriculture, manufacturing, education, health services, and other sectors.
Capital of the financial variety has been the primary focus so far as baby boomers begin retiring. At the same time, though, there are other aspects of wealth to think about. Land doesn’t get up and walk away from a community. Fiber cable doesn’t pull itself up from the ground and roll itself into a ball. Ownership may change, but ultimately the land, the soil, concrete, and lakes are resources of the community. Each generation has invested in that place through a variety of ways. We have been building considerable equity (stock) over the years, and many of these public-value improvements can be realized privately.
Examining Trends with a Capital Lens
This article builds on the Community Capitals Framework approach detailed in the publication “Wealth Creation in Rural Communities,”[ix] using case studies to illustrate each indicator. Since this paper is intended to be a brief examination rather than a full study, I encourage you to read that full publication. A few of their sample indicators include broadband access (social capital), patents in use (human/intellectual capital), and electric generation capacity (built capital).
Discussions on “capital” tend to examine the flow of income in and out of a community, with the goal of finding strategies that maximize returns on income or create greater efficiencies that reduce expenses. Instead, this article will focus on the equity, or non-cash value, that exists in our rural communities. We’ll divide the state into EDA regions, a geographic definition used by many government, public, and private groups in the rural development industry.
Educational Achievement as Human Capital Equity
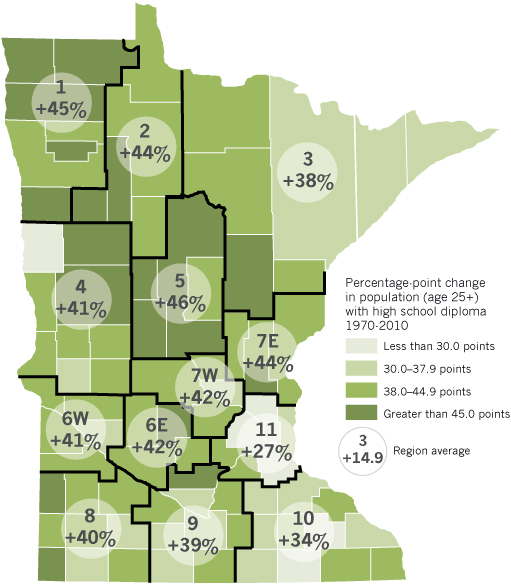
One common measure of human capital in a community or region is educational achievement. Higher levels of educational achievement improve the ability of communities to access sources of knowledge and to make informed decisions. When examining rural environments, measurements aren’t necessarily about the top achievers, such as those with a bachelor’s degree or higher. Instead, the greatest educational gains nationally have been in improving the percentage of the population with a high school degree.
In 1970, about 45% of the national rural population completed high school, but by 2010 that percentage had risen to 88%. Likewise in Minnesota. In 1970, 48% of rural residents had a high school degree; in 2010 it was also 88%. While 40 years may not seem that long, in terms of the progress the population has made in gaining the valuable skills a high school degree represents, it has been a generational shift. Given the disproportionate percentage of the population over the age of 65 in rural places, this progress is remarkable and a positive indicator that communities are able, at the base level of human capital, to tackle issues in their community.
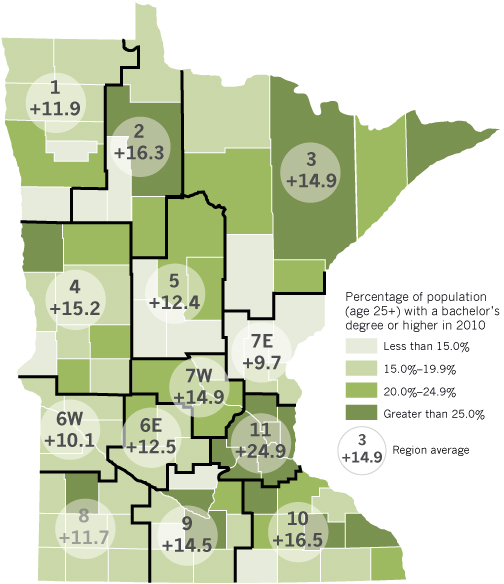
As expected, the metropolitan parts of the state are home to the greatest percentage of residents with a bachelor’s degree or higher. At the same time, though, the gains found in rural counties indicate they are attracting people with advanced degrees as well. As “rural brain gain” research has demonstrated, since 1970 people aged 30-49 have been moving to rural areas,[x] helping to stimulate population growth and school enrollments across Minnesota.
Tables of data discussed in this article by region.
Nonprofit Entities as Community Social Equity
Social capital can be identified as the “connections among people and organizations or the social glue to make things, positive or negative, happen.”[xi] It’s these connections that act as precursors to positive social development. Nonprofit groups can be used as a measure of social capital when they act as vehicles through which community life and community action happen. In this example, we’ll measure capital in terms of the number of nonprofit groups and their assets in a community. The National Center for Charitable Statistics manages historical databases of this information at the county level.[xii].
While the population in Minnesota increased by 8% between 2000 and 2010, the number of nonprofits grew by an astounding 19%, which indicates that these groups play a vital role in community life. Region 1 in the northwest was the only EDA region to experience a decline in its number of nonprofits. It should be noted, however, that a decline in nonprofits does not mean there we no new nonprofits formed, it’s just a net loss overall.
We’ll use the Bureau of Labor Statistics’ Consumer Price Index (CPI) to estimate the value of nonprofit assets from the year 2000 to control for inflation. For every $1 in 2000, the CPI estimates the value to be $1.27 in 2010. The difference between the growth (or loss) in nonprofit assets and the change in CPI value over those ten years would indicate an above- or below-average growth for those assets over that time. Here we do find some differentials by region.
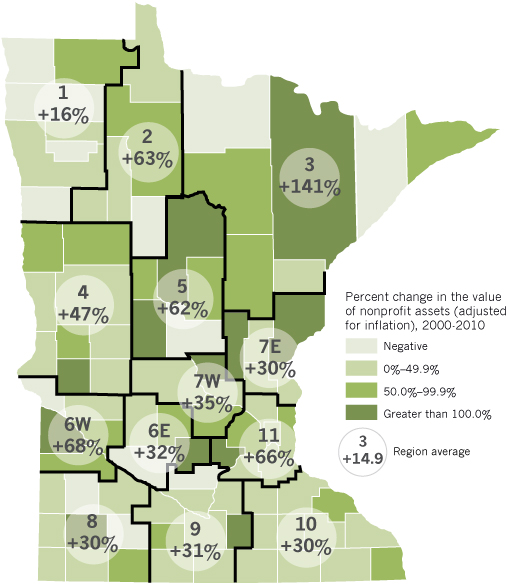
Nonprofit groups hold $141 billion in assets in 2010, up from almost $87 billion in 2010. Between 2000 and 2010, Minnesota nonprofit assets (when adjusted for inflation) grew by 63%. This varies by region as the table above shows. EDA Region 1 grew by only 16%, while EDA Region 6W grew by 68%. The Twin Cities metropolitan area has the greatest concentration of these assets, comprising 77% of all nonprofit assets in 2000 and 79% in 2010. At the same time, though, rural Minnesota has made some significant progress, reflecting a growing capacity to support the social infrastructure of our small towns. There were six counties that did experience declines in nonprofit assets during this time period: Hubbard (-13%), Koochiching (-13%), Morrison (-26%), Renville (-65%), Scott (-4%), and Sibley (-17%). Financial markets may have also influenced these figures since a portion of nonprofit assets could be investments that saw above-average growth during this time period.
To better determine the extent to which these assets are distributed in relationship to the population, we calculated total assets per-capita (per-person) and broke them out by EDA region, again, after controlling for inflation. Statewide, per-capita nonprofit assets are up by over half since 2000 (51%), even after controlling for inflation. The regions with the largest per-capita assets are the Twin Cities metropolitan area (Region 11), and the regions that are home to Duluth (3) and Rochester (10). While these regions show significantly higher values, it should be noted that many nonprofits place their “home” in these larger urban areas and can include groups that focus on national and international goals. These points aside, we do see considerable growth across the rural landscape as well.
Tables of data discussed in this article by region.
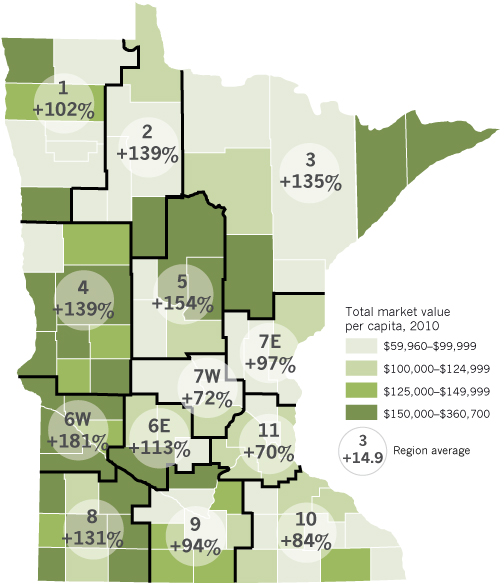
Taxable Market Value as Built Capital Equity
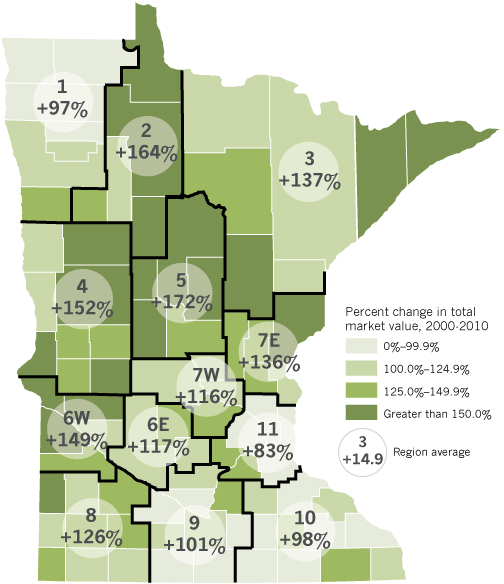
While land and buildings across the state may be held privately, they are also an asset for the community in the sense that they do not just leave town when their owners pass on. Rather, they represent an opportunity for the next generation of residents to take over the reins and improve their land. As home and land values improve, the equity that is built in terms of a tax base benefits the community as a whole. For this example, we’ll look at the change in the Taxable Market Value (TMV) of EDA regions between 2000 and 2010.
Rural Minnesota experienced large gains over this time period, especially in recreational and agricultural areas of the state. In 2000, 59% of all taxable value was found in EDA Region 11 (the seven-county Twin Cities area), but this region’s share fell to 54% in 2010. We can also look at per-capita TMV to better capture the variations in population density across the state. Again, rural Minnesota has great wealth by this measure, and experienced gains much greater than average between 2000 and 2010.
Tables of data discussed in this article by region.
Water Quality as Natural Capital
In the area of natural capital, our lakes are seen as a tremendous resource and contribute to community wealth in many ways. Tourism, vacation homes, and state identity are intrinsically tied to this example of community capital, but it is also threatened when water quality declines. In a 2003 study submitted to the Legislative Commission on Minnesota Resources, it was found that “water quality has a positive relationship with property values.”[xiii] If the water quality on a property decreases, the price change per water frontage foot declined at a rate greater than if the water quality had increased. As an example, a property on Big Sandy Lake in Aitkin County would witness a $218 increase in value per lake frontage foot if water quality increased by 1 meter as measured by a secchi disk. Yet if the water quality decreased by 1 meter, the result would be a $516 decrease per lake frontage foot. So an investment in improving the water quality of our lakes has a direct private benefit to the waterfront landholders. At the same time, that equity is also banked for the community in the form of stable property tax revenues and attractive amenities.
Conclusion
The Community Capitals Framework can be a valuable tool in discerning aspects of rural life that may have been missed when we look at wealth in solely individual, financial terms. These were just a few examples of community capital, but they demonstrate the complex relationship between individual wealth and community wealth. Each generation of rural residents continues to build on the wealth of our communities: even in areas of the state where the population has declined, community wealth continues to grow.
Special thanks to Steve Taff with the University of Minnesota Department of Applied Economics for his insights into the inter-relationship between public and private value as they relate to water quality.
Notes
[i] Winchester, Benjamin; Nash, Art; and Tobias Spanier. 2011. The Glass Half Full: A New View of Rural Minnesota. Rural Minnesota Journal 6(1): 1-30.
[ii] Pender, John and Shanna Ratner. 2014. Wealth Concepts in Rural Wealth Creation, edited by John Pender et al. p.17.
[iii] http://www.mcf.org/resources/transfer
[iv] Arrow, Kenneth, et al. 2010. Sustainability and the Measure of Wealth. NBER Working paper 16559, National Bureau of Economic Research. Cambridge, MA.
[v] Pender, John; Marre, Alexander; and Richard Reeder. Rural Wealth Creation: Concepts, Strategies, and Measures. Economic Research Report 131. U.S. Department of Agriculture, Economic Research Service.
[vi] Pender, John; Weber, Bruce; and Wayne Fawbush. 2012. Theme Overview: Rural Wealth Creation. Choices Magazine, Agriculuture and Applied Economic Association. 27(1).
[vii] Emery, M., S. Fey, and C.B. Flora, 2006. “Using Community Capitals to Build Assets for Positive Community Change.” CD Practice 13.
[viii] Hart, M. (1999). Guide to sustainable community indicators. West Hartford: CT: Sustainable Measures.
[ix] http://www.yellowwood.org/wealthcreation.aspx
[x] Winchester, Benjamin; Nash, Art; and Tobias Spanier. 2011. The Glass Half Full: A New View of Rural Minnesota. Rural Minnesota Journal 6(1): 1-30.
[xi] Coleman, J. S. (1988). Social Capital in the Creation of Human Capital. The American Journal of Sociology 94:95-120.
[xii] In some cases it was apparent that there was an outstanding event in the nonprofit asset data which could be attributed to large grants or one-time events. Data from the closest corresponding year was then used. Clay County nonprofit assets in 2010 ($352,548,394) were replaced with 2011 ($141,563,384) values. Dodge County nonprofit assets in 2000 ($39,776,664) were replaced with 1999 ($5,723,812) values. Lyon County nonprofit assets in 2000 ($683,654,886) were replaced with 1998 ($65,129,074) values. Sherburne County nonprofit assets in 2000 ($641,765,031) were replaced with 1999 ($47,771.477) values.
[xiii] Krysel, Charles; Boyer, Elizabeth; Parson, Charles; and Patrick Welle. 2003. Lakeshore property values and water quality: evidence from property sales in the Mississippi Headwaters region. Bemidji State University submitted to the Legislative Commission on Minnesota Resources.